|
1
|
|
2
|
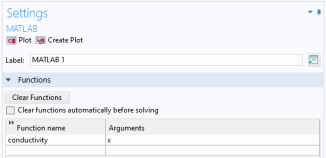
On the Settings page, under the Functions section, enter conductivity in the Function name field, and enter x in the Arguments field.
 |
|
3
|
|
4
|
Expand the Plot parameters section. In the associated table enter 0 as the Lower limit and 1 as the Upper limit.
|
|
6
|
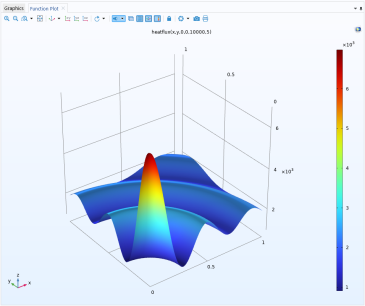
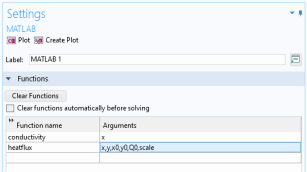
Repeating the above procedure, enter heatflux in the Function name field and enter x,y,x0,y0,Q0,scale in the Arguments field.
 |
 . Under the Global section, select MATLAB
  . On Linux and macOS, this can be found in the Model Toolbar.
 . Select COMSOL Application (*.mph) in the Save as type list, and browse to the directory where the files
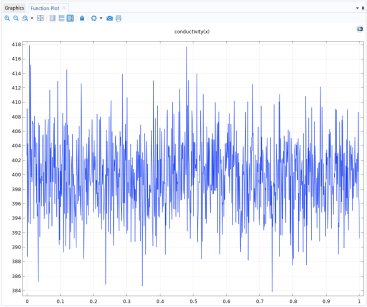
  . This will start the MATLAB engine where the function is evaluated and produce the following plot.
 .
.