With the tools in the Numerical Results group you can evaluate expressions and insert the evaluation results from a table in the model into the worksheet. In order to extract numerical results from a model, first select an empty cell in the worksheet where the data will be inserted.
Click Parameters (

) to insert the parameters found in the
Parameters node in the
Results branch of the model tree into the worksheet. In contrast to the parameters available in the
Definitions section, the results parameters can be used for calculating results without having to update or solve the model.
See ResultsParameters for information about the corresponding VBA command.
Click Derived Values (

) and select a Derived Values node to evaluate and insert into the worksheet. Expressions need to be defined under the Derived Values node of the model tree to be displayed in the list.
See ResultsDerivedValue for information about the corresponding VBA command.
Click Point Evaluation (

) to open the
Point Evaluation window.
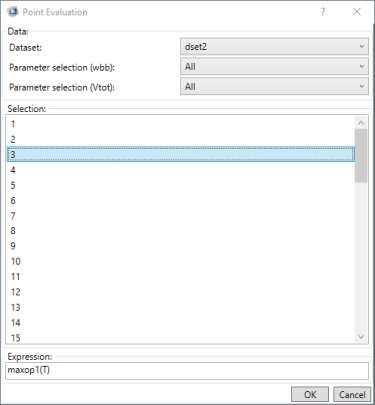
In the Point Evaluation window select the
Dataset to evaluate on, and specify the points where the expression should be evaluated. Enter a valid expression into the
Expression field; then click
OK to perform the evaluation. The results are inserted into the worksheet at the selected cell, and linked to the model with a comment on the cell.
See ResultsPointEvaluation for information about the corresponding VBA command.
Under Ray and Particle click
Ray Evaluation (

) to open the
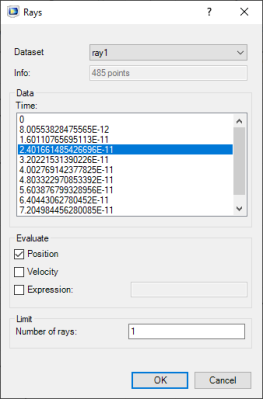
Rays window where you can evaluate expressions along ray trajectories.
Select a ray dataset from the Dataset list. From the
Evaluate section select any of the following options:
|
•
|
Position, to include in the evaluation the ray position along the trajectories.
|
|
•
|
Velocity, to include in the evaluation the ray velocity along the trajectories.
|
|
•
|
Expression, to include in the evaluation along ray trajectories the expression you specify.
|
Reduce the evaluation output by entering the number of rays for the evaluation in the Number of rays text field. Click
OK to perform the evaluation and to insert the results into the worksheet. The results are inserted at the selected cell, and linked to the model with a comment on the cell.
See ResultsRayEvaluation for information about the corresponding VBA command.
Under Ray and Particle click
Particle Evaluation (

) to open the
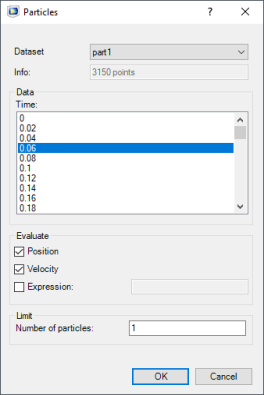
Particles window where you can evaluate expressions along particle trajectories.
Select a particle dataset from the Dataset list. From the
Evaluate section select any of the following options:
|
•
|
Position, to include in the evaluation the particle position along the trajectories.
|
|
•
|
Velocity, to include in the evaluation the particle velocity along the trajectories.
|
|
•
|
Expression, to include in the evaluation along particle trajectories the expression you specify.
|
Reduce the evaluation output by entering the number of particles for the evaluation in the Number of particle text field. Click
OK to perform the evaluation and to insert the results into the worksheet. The results are inserted at the selected cell, and linked to the model with a comment on the cell.
See ResultsParticleEvaluation for information about the corresponding VBA command.
Click Interpolation (

) to open the window with the same name where you can set up the evaluation of expressions at specified coordinates.
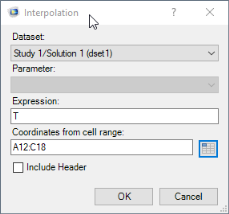
From the Dataset list, choose the solution dataset from the model. For solution datasets of type parametric, select the parameter value from the
Parameter list. In the
Expression text field enter the expression to evaluate. Enter the cell range that contains the coordinates for the interpolation points in the
Coordinates from cell range text field, or click the
Select range button (

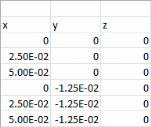
) to select the range from the worksheet. Make sure that you have formatted the point coordinate data such that the x-, y-, and z-coordinates are listed in separate columns, with each row defining an evaluation point, as illustrated in the figure below:
Select Include Header to add a header row to the evaluated data. In this case the data rows are shifted one row down, and a header row is included at the location of the cell comment.
Finally, click OK to evaluate and insert the results into the worksheet. The results are inserted at the selected cell, and linked to the model with a comment on the cell.
See ResultsInterpolation for information about the corresponding VBA command.
Click Tables (

) and select a table from the model for inserting into the worksheet. The table data is inserted at the selected cell, and linked to the model with a comment on the cell.
See ResultsTable for information about the corresponding VBA command.
Click Evaluation Groups (

) and select an Evaluation Group node from the model for evaluating and inserting into the worksheet. The data is inserted at the selected cell, and linked to the model with a comment on the cell.
See EvaluationGroup for information about the corresponding VBA command.
Use 1D Plot Export (

) to extract data from 1D plot groups, insert the data into the worksheet, and create an Excel plot.
To extract plot data from the model, first select the cell in the worksheet where you want to insert the data, then click 1D Plot Export (

) and select one of the 1D plot groups that are defined in the model. This opens the
1D Plot Export window where you can change the settings.
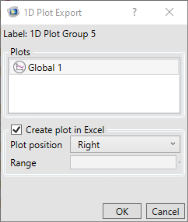
From the Plots list select the plots to extract data from. By default all plots from the plot group are selected.
Select the Create plot in Excel checkbox (selected by default) to generate an Excel chart with the inserted data. To specify where the generated Excel chart is placed in relation to the inserted data select one of the options from the
Plot position list:
Left,
Right (default),
Top,
Bottom, or
Custom to enter the cell in the
Range field for placing the top-left corner of the chart.
See Export1DPlot for information about the corresponding VBA command.
Click Update (

) to update all data evaluations in the current worksheet. Only cell ranges containing a valid link to the model are updated. Note that this will not update cells linked to results tables in the model, to do this see
Clear and Evaluate All.
See UpdateAllResults for information about the corresponding VBA command.
Click Clear and Evaluate All (

) to clear, on the current worksheet, cells linked to results tables in the model, evaluate all derived values, and then update all data evaluations, and the cells linked to results tables.
See ClearAndEvaluateAllResults for information about the corresponding VBA command.