Using the buttons in the Graphics group you can display the model geometry, mesh, and plot groups in the COMSOL Multiphysics server graphics window.
Click Geometry (

) to display the model geometry in the COMSOL Multiphysics server graphics window. In case the model contains multiple geometry nodes, select the geometry to display from the menu. To change the level of detail for the displayed geometry, see
Preference Settings.
See InsertGeometryGraphics for information about the corresponding VBA command.
Click Mesh (

) to display the mesh in the COMSOL Multiphysics server graphics window. In case the model contains multiple mesh nodes, select the mesh node to display from the menu.
See InsertMeshGraphics for information about the corresponding VBA command.
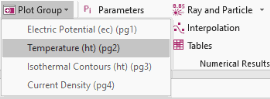
Click Plot Group (

) and select a plot group to display it in the COMSOL Multiphysics server graphics window. Only plot groups that are defined in the open model can be displayed.
Click Insert Screenshot (

) to generate and insert into the worksheet a screenshot image of the currently displayed contents of the COMSOL Multiphysics server Graphics window. The image can be exported from the graphics or directly taken as a screenshot. You can specify how you want the image and its size from the
Preferences window.
See InsertGraphics for information about the corresponding VBA command.