Importing 1D Plot Data
If your model contains 1D plots you can in one step extract the plot data to a worksheet and create an Excel chart.
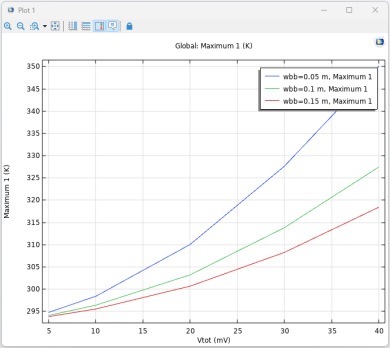
The currently open model of the busbar contains a 1D plot of the maximum temperature plotted against the applied voltage for the different width parameter values.
1
From the Graphics group, click the Plot Group button
, then select 1D Plot Group5 (pg5) to display it in the Graphics window.
Instead of inserting this plot as a static image, we will insert the plot data, and create a scatter chart in the worksheet.
2
In Sheet 1 delete the previously inserted image, and select cell E13.
3
Click the 1D Plot Export button
, and select 1D Plot Group 5 (pg5).
4
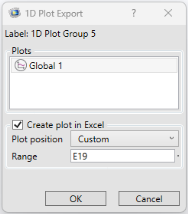
This opens a dialog where you can select the data to be inserted into the worksheet.
In case the selected plot group contains more than one plot, the plot features appear in the Plots list, and you can select those that you want to extract data from. In this case, 1D Plot Group 5 contains the Global 1 plot feature that is already selected. With the default settings a chart based on the extracted data is also created in the sheet. Use the Plot position setting to select where to place the chart on the sheet.
5
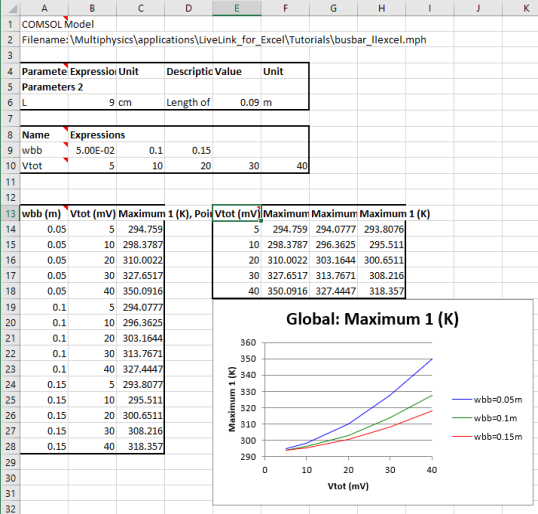
From the Plot position list, select Custom and enter E19 in the Range field. Click OK.
The final chart looks like this when using the default settings: