Computing the Solution
Continue with solving the model.
1
In the Study group, click the Compute button
.
In case the model contains several studies, you can select Compute > Study
, then select the study to solve.
2
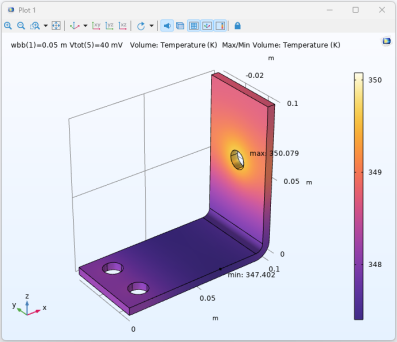
From the Graphics group, click the Plot Group button
, then select Temperature (ht) (pg3).
The Graphics window is updated with the temperature distribution in the busbar for the first width parameter value in the recomputed sweep.