Displaying the Solution
You can display the solution using the plot group defined in the model. You can find the plot groups available in the Plot Group list.
1
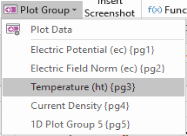
Click the Plot Group button
, from the Graphics group, to select the plot group to display. Here, select Temperature (ht) (pg3).
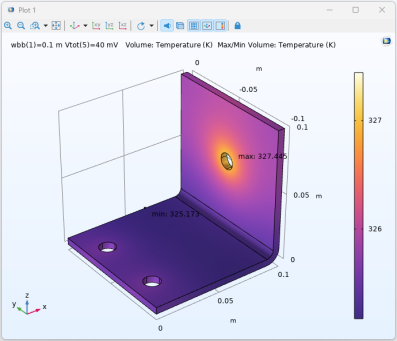
The graphics window now displays the temperature distribution in the busbar as in the figure below:
The plot represents the solution from the saved model.
Note:
For time dependent solutions or parametric sweeps, you can select the solution to display by selecting the Plot Group > Plot Data
from the Graphics group on the ribbon tab.
2
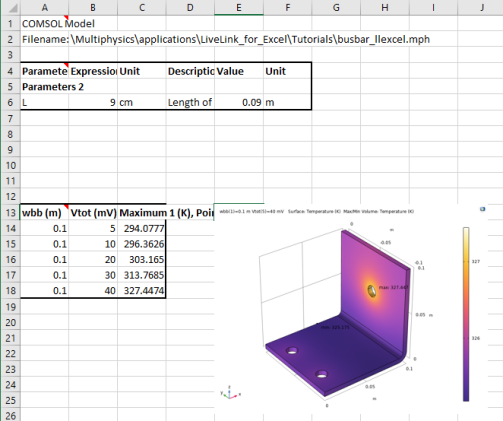
To insert the displayed image into the worksheet, switch to Sheet 1 and select cell E13, then click Insert Screenshot
from the Graphics group.
Note:
While you can manually adjust the size of the image, you can also specify the graphics scale when inserting the displayed image. You can find the settings for inserting graphics in the Preferences window, which is accessible from the COMSOL Backstage view.