Extracting Results
The model loaded on the COMSOL Multiphysics server already contains a solution. It also contains an operator to evaluate the maximum in the busbar domain. Continue with the steps below to import the maximum temperature of the busbar to the worksheet.
Point Evaluation
1
2
3
4
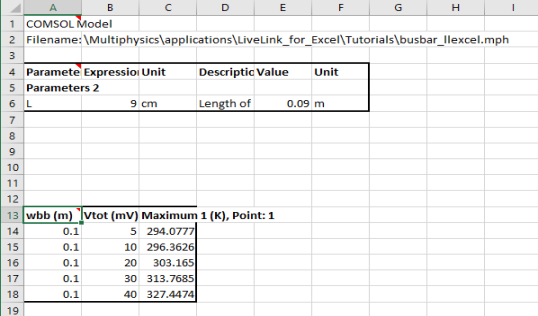
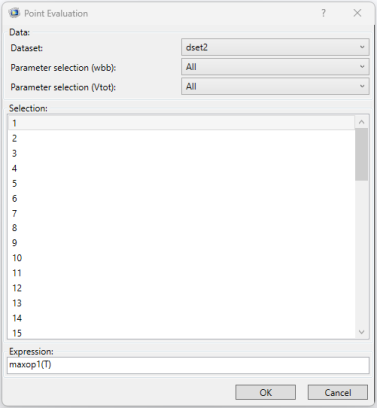
Select point 1 from the Selection list and enter maxop1(T) in the Expression text field; then click OK.
In the Excel spreadsheet, the cells containing the evaluated results are now linked to the model and can be updated if you want to recompute the solution using different parameter values.
Interpolation
Continue by calculating how much heat is produced in the busbar at coordinates that you specify in the worksheet.
1
2
3
4
5
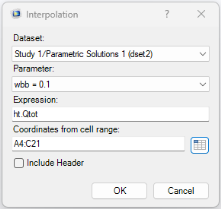
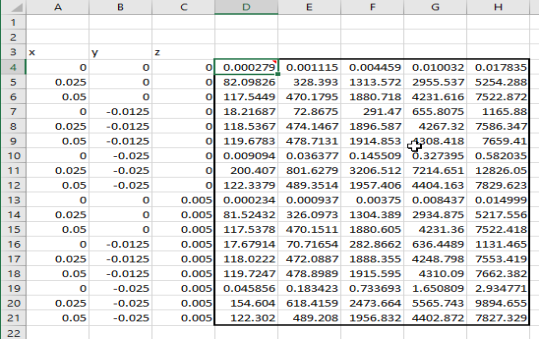
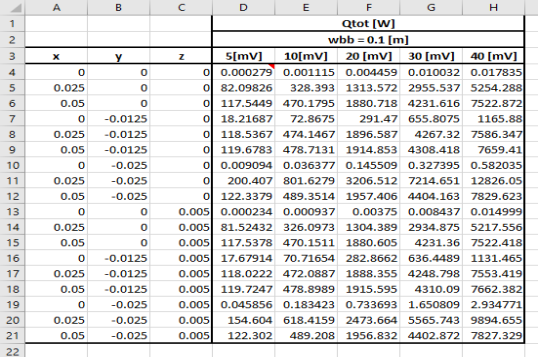
In the Interpolation dialog, in the Expression text field, enter ht.Qtot, which is the total heat source to be evaluated.
6
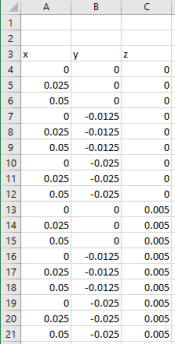
In the Coordinates from cell range text field, enter A4:C21. This is the range containing the coordinates of the interpolation points. You can also click the Select Range button () to select the cell range.
7
The evaluation results are stored in a cell range of size 18 x 5, where 18 equals the number of interpolation points and 5 is the number of parameter values contained in the solution. In this case, the solution consists of a parameter sweep over the applied voltage on the device, which varies from 5 mV to 40 mV.
8