Results
Plot the temperature for the case with average values for the mixture properties.
Temperature
1
In the Model Builder window click
Results >
Temperature.
2
In the Settings window for 2D Plot Group, locate the Data section.
3
From the Dataset list, choose Study 5: Glycol and Water, Constant Properties/Solution 7 (sol7).
4
In the Temperature toolbar, click
Plot.
You can now compute the outlet temperature, the average pressure drop, and the average outlet density for the four simulations performed:
•
Water
•
Glycol and Water, Vel = 1.0 m/s
•
Glycol and Water, Vel = 1.15 m/s
•
Glycol and Water, Constant Properties
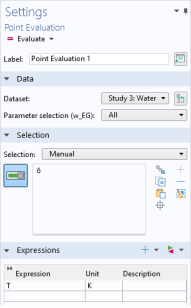
First add a Point Evaluation node to study the outlet temperature.
Point Evaluation: Outlet Temperature
1
In the Results toolbar, click
Point Evaluation.
2
Select Point 6, the uppermost point in the solid domain on the symmetry line. Do so by clicking in the Graphics window and verifying the selection in the Selection section in the Settings window for Point Evaluation.
3
Locate the Expressions section and enter the following settings in the table:
Expression
Unit
Description
T
K
4
Locate the Data section. From the Dataset list, choose Study 3: Water/Solution 3 (sol3).
5
Click
Evaluate at the top of the Settings window.
6
From the Dataset list, choose Study 4: Glycol and Water/Vel = 1.0 m/s (sol6).
7
Click
next to
Evaluate, then choose New Table to add the evaluation to a new table.
8
From the Dataset list, choose Study 4: Glycol and Water/Vel = 1.15 m/s (sol5).
9
Click
next to
Evaluate, then choose New Table.
10
From the Dataset list, choose Study 5: Glycol and Water, Constant Properties /Solution 7 (sol7).
11
Click
next to
Evaluate, then choose New Table.
In this manner, four tables (Table 2–5), containing the outlet temperature, have been added under Tables
, one for each of the coolant simulations performed.
Next, add a Line Average node to compute the average pressure at the inlet. Since a zero reference pressure is applied at the outlet, the inlet pressure represents the pressure drop over the system.
Line Average: Pressure Drop
1
In the Results toolbar, click
More Derived Values and choose Average >
Line Average.
2
Select Boundary 2 at the bottom of the geometry, corresponding to the inlet.
3
In the Settings window for Line Average, locate the Expressions section.
4
In the table, enter the following settings:
Expression
Unit
Description
p
Pa
5
Locate the Data section. From the Dataset list, choose Study 3: Water/Solution 3 (sol3).
6
Click
Evaluate (Table 2 - Point Evaluation 1).
In the same manner, perform the same steps to derive the pressure drop for the remaining flow solutions. Add the pressure drop to the table containing the outlet temperature for the same case.
7
From the Dataset list, choose Study 4: Glycol and Water/Vel = 1.0 m/s (sol6).
8
Click
next to
Evaluate, then choose Table 3 - Point Evaluation 1. Click
Evaluate.
9
From the Dataset list, choose Study 4: Glycol and Water/Vel = 1.15 m/s (sol5).
10
Click
next to
Evaluate, then choose Table 4 - Point Evaluation 1. Click
Evaluate.
11
From the Dataset list, choose Study 5: Glycol and Water, Constant Properties/Solution 7 (sol7).
12
Click
next to
Evaluate, then choose Table 5 - Point Evaluation 1. Click
Evaluate.
Finally, add another Line Average node to compute the average density at the outlet.
Line Average: Outlet Density
1
In the Results toolbar, click
More Derived Values and choose Average >
Line Average.
2
Select Boundary 11, the outlet boundary.
3
In the Settings window for Line Average, locate the Expressions section.
4
In the table, enter the following settings (the density defined by the Heat Transfer in Fluids (ht)
interface):
Expression
Unit
Description
ht.rho
kg/m^3
5
Locate the Data section. From the Dataset list, choose Study 3: Water/Solution 3 (sol3).
6
Click
next to
Evaluate, then choose Table 2 - Point Evaluation 1. Click
Evaluate.
7
From the Dataset list, choose Study 4: Glycol and Water/Vel = 1.0 m/s (sol6).
8
Click
next to
Evaluate, then choose Table 3 - Point Evaluation 1. Click
Evaluate.
9
From the Dataset list, choose Study 4: Glycol and Water/Vel = 1.15 m/s (sol5).
10
Click
next to
Evaluate, then choose Table 4 - Point Evaluation 1. Click
Evaluate.
11
From the Dataset list, choose Study 5: Glycol and Water, Constant Properties/Solution 7 (sol7).
12
Click
next to
Evaluate, then choose Table 5 - Point Evaluation 1. Click
Evaluate.