Results
Five default plots are generated automatically. The first four represent respectively the temperature field in both the solid and fluid domain, the velocity magnitude of the fluid flow, the pressure profile on the boundaries and the surface radiosity on the boundaries. The last default plot is identical to the predefined plot previously added and shows the temperature in the heat sink and on the channel walls together with the flow structure.
1
2
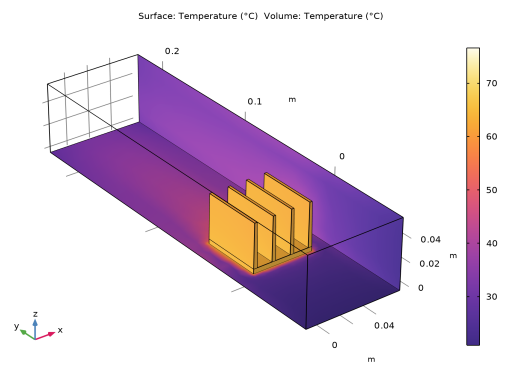
In the Settings window for 3D Plot Group, type Temperature of the channel walls and heat sink, with radiation in the Label text field.
3
4
5
By comparing this plot with the previous temperature plot we observe that the heat transfer by radiation induces a significant cooling and that the maximum temperature is about 10°C lower when thermal radiation is accounted for.
In order to visualize the temperature on each side of the thermal contact, follow the next steps.
Contact Temperature (ht)
1
2
3