Results
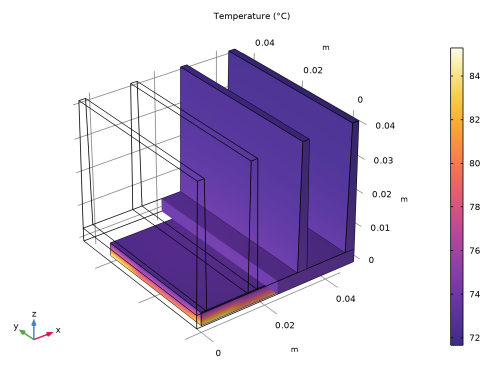
The automatically generated default plot shows the temperature in the domain. Modify this plot to display the temperature at the interface between the chip and the heat sink.
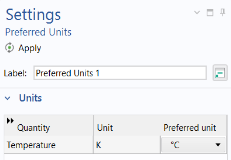
In order to display the temperature plots under the Results branch in °C, you can add a Preferred Units node.
1
In the Results toolbar, click Configurations
and choose Preferred Units
.
2
Click Add Physical Quantity
and, in the Physical Quantity dialog, select General > Temperature (K) in the tree. Click OK.
3
Choose °C as the Preferred unit for the Temperature.
4
Click Apply
.
Selection 1
1
Right-click Volume 1
and choose Selection
.
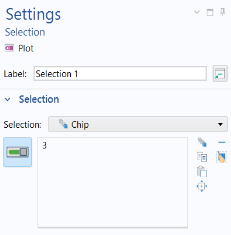
2
In the Selection list, choose Chip.
Volume 2
1
Right-click Volume 1
and choose Duplicate
.
2
In the Settings window for Volume 2, expand the Title section and set the Title type to None.
3
Expand the Inherit Style section and from the Plot list select Volume 1.
Selection 1
1
Expand the Volume 2
node and click Selection 1
.
2
In the Selection list, choose All (Heat Sink - Straights Fins 1)
Filter 1
Add a filter to display only half of the heat sink and enable seeing the chip surface.
1
Right-click Volume 2
and choose Filter
.
2
In the Settings window for Filter, locate the Element Selection section
3
In the Logical expression for inclusion text field, type
x>0.02
.
4
In the Temperature (ht) toolbar, click the Plot
button.
Compare with temperature plot above.