|
3
|
|
2
|
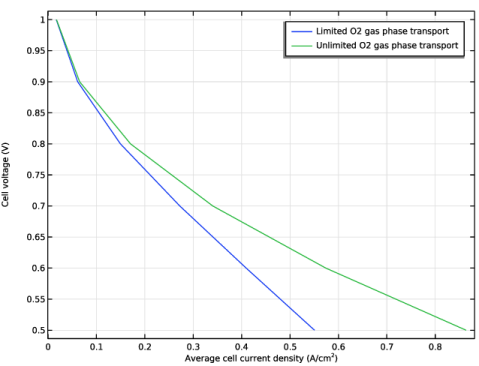
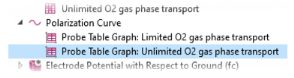
In the Settings window for Table Graph, type Probe Table Graph: Limited O2 gas phase transport in the Label text field.
|
|
6
|
In the Settings window for Table Graph, type Probe Table Graph: Unlimited O2 gas phase transport in the Label text field.
|
|
2
|
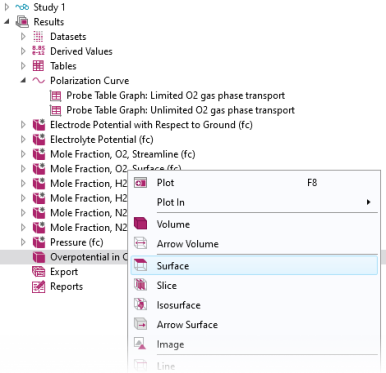
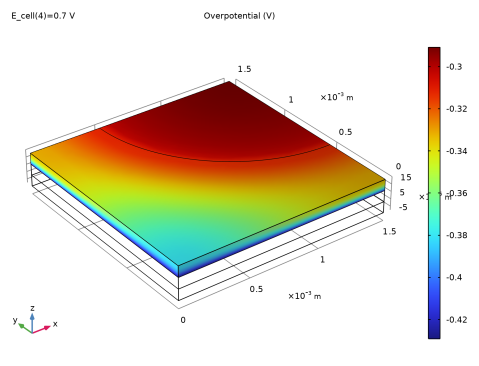
In the Settings window for 3D Plot Group, type Overpotential in Cathode in the Label text field.
|
|
1
|
|
2
|
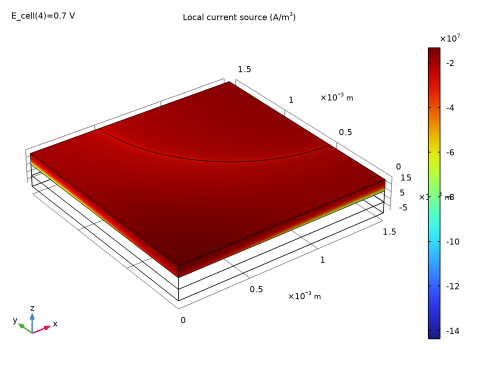
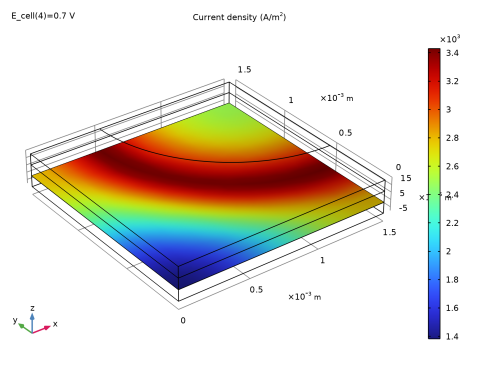
In the Settings window for 3D Plot Group, type Local Volumetric Current Density in Cathode in the Label text field.
|
|
3
|
|
5
|
In the associated text field, type Current density.
|
|
9
|
|
10
|
In the Unit field, type A/cm^2.
|
|
3
|
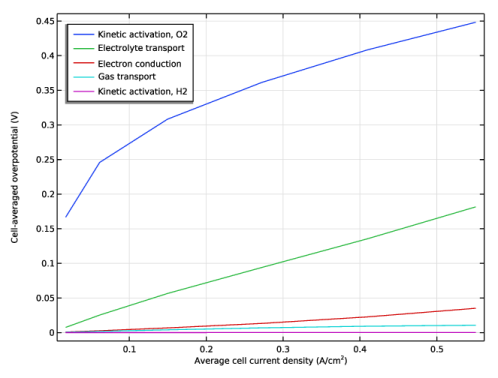
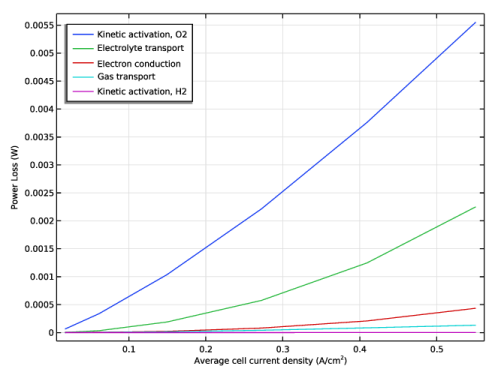
Select the x-axis label checkbox. In the associated text field, type Average cell current density (A/cm<sup>2</sup>).
|
|
4
|
|
2
|
|
3
|
In y-axis label text field, type Cell-averaged overpotential (V).
|
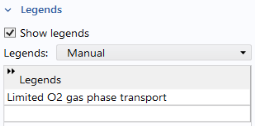
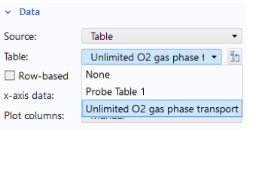 Unlimited O2 gas phase transport.