|
7
|
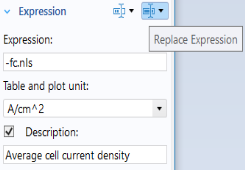
Select the Description checkbox and in the associated text field, type Average cell current density.
|
|
2
|
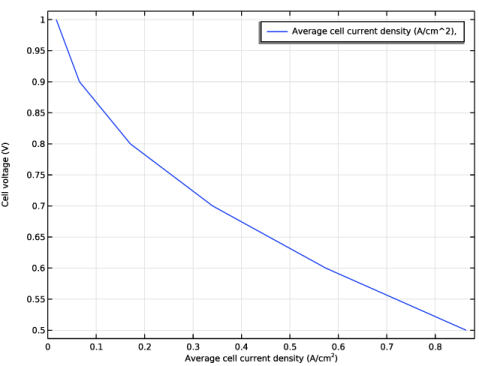
In the Label text field, type Polarization Curve.
|
|
6
|
In the associated text field, type Cell voltage (V).
|