|
1
|
|
7
|
|
2
|
Change the Label field to Deposition Thickness.
|
|
3
|
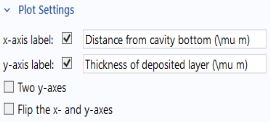
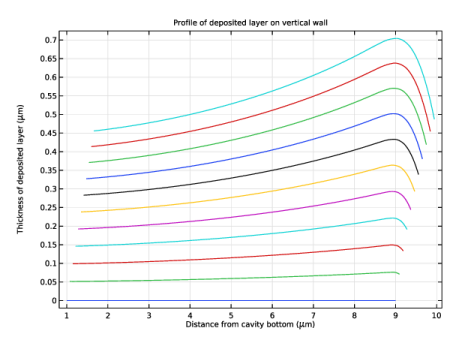
Click to expand the Title section. Select Manual and enter (or copy and paste) Profile of deposited layer on vertical wall as the title.
|
|
-
|
Select the x-axis label checkbox and enter Distance from cavity bottom (\mu m).
|
|
-
|
|
6
|
In the Settings window for Line Graph click the Paste Selection button
|
|
7
|
|
8
|
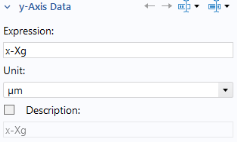
Under x-Axis Data, from the Parameter list, select Expression. In the Expression text field, enter y and select micrometer in the Unit list.
|
 Add a 1D Plot Group and Define a 1D Line Graph