Cyclic Voltammetry at a Macroelectrode in 1D
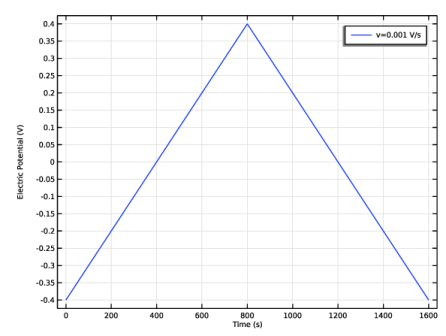
Cyclic voltammetry is a common analytical technique for investigating electrochemical systems. In this method, the potential difference between a working electrode and a reference electrode is swept linearly in time from a start potential to a vertex potential, and back again (see Figure 10). The resulting current at the working electrode is recorded and is plotted against the applied electrode potential in a voltammogram.
Figure 10: Potential of the working electrode during one voltammetric cycle. The potential is cycled between the vertex potentials 0.4 V and –0.4 V. The scan rate is 1 mV/s.
Voltammetry is a valuable technique because information about both the electrochemical reactivity and the transport properties of a system can be extracted simultaneously. For quantitative interpretation of voltammetry, however, we must use numerical methods to solve the physical equations that describe voltammetry. Then, unknown physical quantities in the system can be inferred by ‘fitting’ to experimental data.
This example demonstrates the use of a common approximation in which a large electrode (macroelectrode) is assumed to have uniform transport behavior across its surface, so only physics occurring normal to the surface need to be considered. By simplifying the model to 1D, an efficient time-dependent analysis is possible.
In this model, a Parametric Sweep is used to compare voltammetry recorded at different voltammetric scan rates.
Model Definition
The model contains a single 1D domain of length L, which is the maximum extent of the diffusion layer over the duration of the voltammetry experiment. A conservative setting for L is set to greatly exceed the mean diffusion layer thickness:
Here, D is the diffusion coefficient of the reactant and tmax is the duration of the cyclic voltammogram.
DOMAIN EQUATIONS
We assume the presence of a large quantity of supporting electrolyte. This is inert salt that is added in electroanalytical experiments to increase the conductivity of the electrolyte without otherwise interfering with the reaction chemistry. Under these conditions, the resistance of the solution is sufficiently low that the electric field is negligible, and we can assume .
The Electroanalysis interface implements chemical transport equations for the reactant and product species of the redox couple subject to this assumption. The domain equation is the diffusion equation (also known as Fick’s second law) to describe the chemical transport of the electroactive species A and B:
BOUNDARY EQUATIONS
At the bulk boundary (x = L), we assume a uniform concentration equal to the bulk concentration for the reactant. The product has zero concentration here, as in bulk.
At the electrode boundary (x = 0), the reactant species A oxidizes (loses one electron) to form the product B. By convention, electrochemical reactions are written in the reduction direction:
The stoichiometric coefficient is –1 for B, the “reactant” in the reduction direction, and +1 for A, the “product” in the reduction direction. This formulation is consistent even in examples such as this model where at certain applied potentials, the reaction proceeds favorably to convert A to B. The number of electrons transferred, n, equals one.
The current density iloc for this reaction is given by the electroanalytical Butler–Volmer equation for an oxidation reaction:
in which k0 is the heterogeneous rate constant of the reaction, αc is the cathodic transfer coefficient, and η is the overpotential at the working electrode. This overpotential is the difference between the applied potential and the equilibrium potential (formal reduction potential) of the redox couple of species A and B.
According to Faraday’s laws of electrolysis, the flux of the reactant and product species are proportional to the current density drawn:
Here -nNj is the molar flux normal to the electrode surface and νi is the stoichiometric coefficient. This is expressed in the Electrode Surface boundary condition in the Electroanalysis Module.
The applied triangular waveform for the cyclic voltammetry study is specified in the Electrode Surface boundary condition according to two vertex potentials —forming a potential window between –0.4 V and +0.4 V, either side of the equilibrium reduction potential — and a voltammetric scan rate, v (V/s), which is the rate at which the applied potential is changed.
In the 1D approximation, the total current is related to the current density simply by multiplying by the electrode area A:
CYCLIC VOLTAMMETRY STUDY
In the cyclic voltammetry experiment, the potential applied to the working electrode surface is varied linearly as a function of time. A Parametric Sweep is used to compare the voltammetry recorded at different scan rates.
Results and Discussion
The shape of the cyclic voltammogram (Figure 11) shows the relation between electrode kinetics and chemical species transport (diffusion).
Figure 11: Cyclic voltammetry recorded at a macroelectrode.
Initially, at reducing potentials, the oxidation reaction is not driven and negligible current is drawn. As the potential is ramped conversion toward the reduction potential of the redox couple, the oxidation reaction is accelerated and the current increases. Once the oxidation reaction has consumed the reactant at the electrode surface, the current becomes limited by the rate of transport of A toward the working electrode. Therefore, a peak current is observed, and at higher potentials, the voltammetric current falls off at a potential-independent rate; this region is termed “diffusion-controlled” or “transport-controlled”.
On sweeping back toward more reducing potentials, the conversion of the product B into the original reactant A gives a negative (cathodic, reduction) current. Depletion of the reacting species B causes a negative peak current and conversion thereafter proceeds at a diffusion-controlled rate.
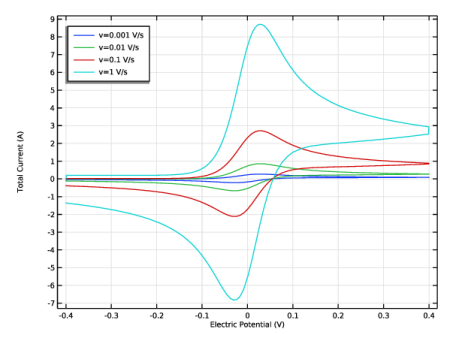
The magnitude of the current on the forward peak, Ipf, is a common diagnostic variable in voltammetry. For fast electrode kinetics and at a macroelectrode under the 1D approximation, its value is given theoretically by the Randles–Ševcík equation (see Ref. 1 and Ref. 2 for a detailed discussion and derivation):
where A is the electrode area, c is the bulk concentration of the reactant, and D is the diffusion coefficient of the reactant.
The square-root relationship between peak current and scan rate is characteristic of macroelectrode cyclic voltammetry under the above conditions.
References
1
R.G. Compton and C.E. Banks, Understanding Voltammetry, 2nd ed., London, 2011.
2
A.J. Bard and L.R. Faulkner, Electrochemical Methods, Fundamentals and Applications, 2nd ed., Wiley, New York, 2001.