|
1
|
|
2
|
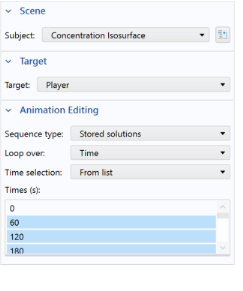
In the Settings window for 3D Plot Group
|
|
3
|
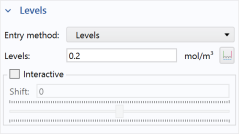
In the Levels section, from the Entry method list, choose Levels and type 0.2 in the Levels text field.
 |
|
4
|
After you have clicked the Zoom Extents
|
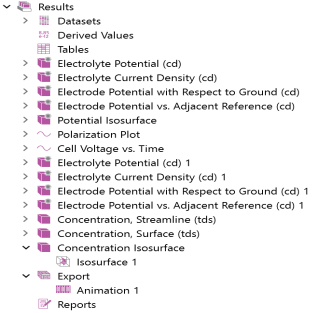
 This generates an Animation 1