Results
The results from this last run can be used to set up a polarization plot:
1
In the Home toolbar, click Add Plot Group
and choose 1D Plot Group
.
2
In the Settings window for 1D Plot Group, type
Polarization Plot
in the Label text field.
3
Click to expand the Title section and choose None from the Title type list.
4
Locate the Plot Settings section. Then select the y-axis label checkbox and type Cell voltage (V) in the associated field.
5
Locate the Legend section and clear the Show legends checkbox
Polarization Plot
1
On the Polarization Plot toolbar, click Global
.
2
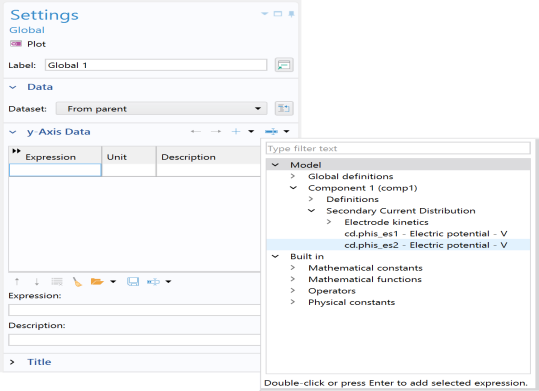
In the Settings window for Global, locate the y-Axis Data section and click Replace Expression
. Select Component 1 > Secondary Current Distribution > cd.phis_es2 - Electric potential from the list that appears.
3
On the Polarization plot toolbar, click Plot
. This generates
Figure 6
above.