|
1
|
|
2
|
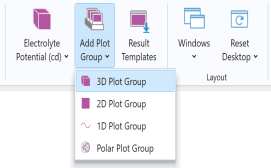
In the Settings window for the 3D Plot Group, type Potential Isosurface in the Label text field.
|
|
3
|
Click Zoom Extents
|