Eeq,0 above denotes the equilibrium potentials at standard conditions versus a standard hydrogen electrode (SHE). In the model, the equilibrium potentials are corrected for the pH and zinc concentration of the orange pulp using the Nernst equation.
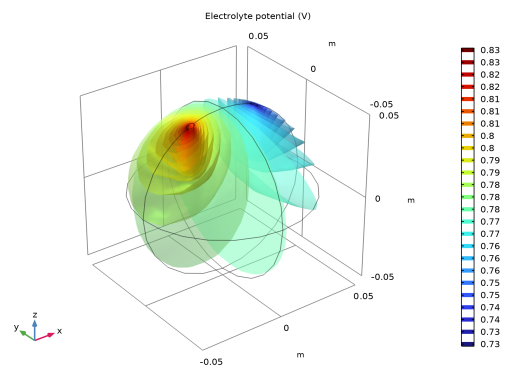
Figure 5 shows the potential field in the orange. The potential decreases as the current flows from the zinc electrode (left) to the upper electrode (right). The main part of the cell voltage loss is due to ohmic losses in the electrolyte.
Figure 6 shows a polarization plot as the total current of the battery increases from 0 to 1 mA. The potential has a nearly linear correlation to the applied current, pointing to ohmic losses in the electrolyte.
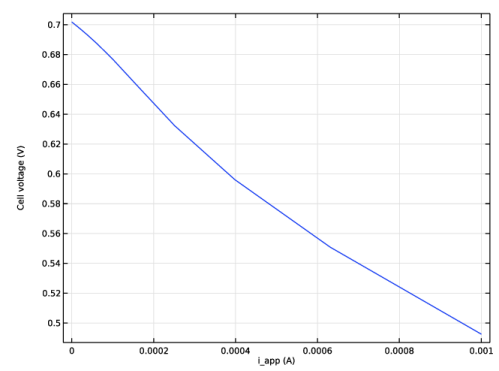
Figure 7 shows an isosurface for the
0.2 mol/m
3 concentration level of zinc ions after running the battery for five minutes.
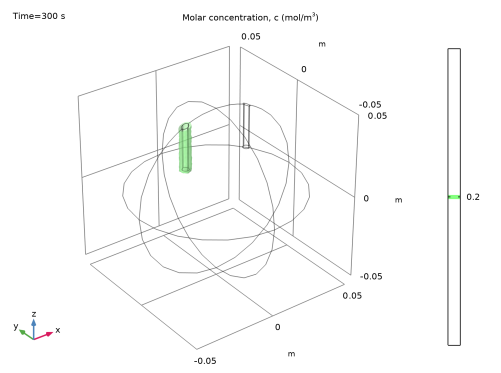
Figure 8 shows how far the
0.2 mol/m
3 isosurface level has reached after one hour.
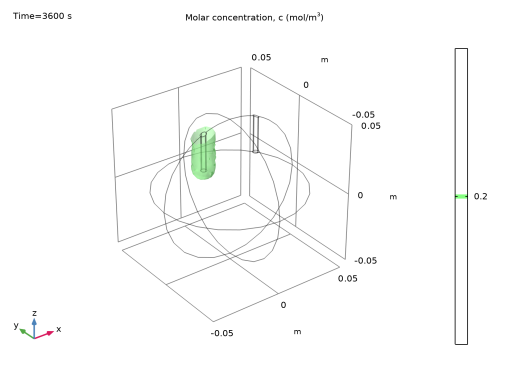
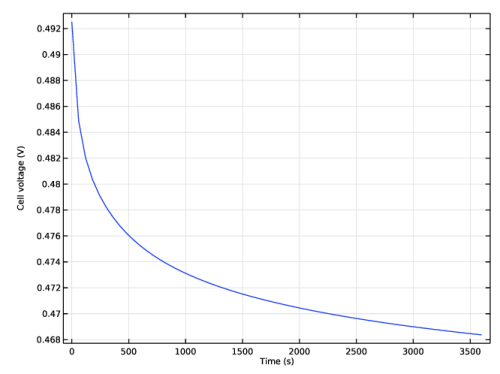
Figure 9 shows how the cell current evolves with time. Due to the increase of zinc ions at the zinc nail electrode, the battery current decreases for a constant cell current.