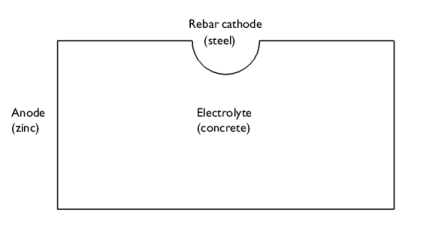
Figure 4 shows the model geometry. The geometry represents a two dimensional cross section of a repeating unit cell in a larger structure where three symmetry planes (top, bottom, and right) have been used to reduce the model geometry. The zinc anode has been coated onto the concrete by thermal spraying and is assumed to be permeable to air.
where Eeq,Zn is an empirically measured equilibrium potential for the thermally sprayed zinc/concrete electrode. In this model
Eeq,Zn is set to
−0.68 V.
Figure 7 shows the electrolyte potential for a pore saturation level of 0.8. The electrolyte potential is lower toward the back (the right side) of the rebar.
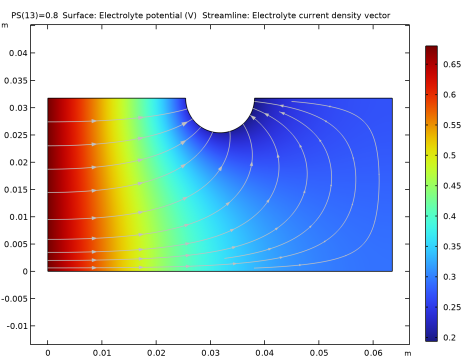
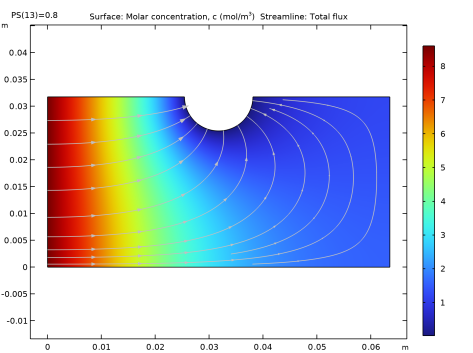
Figure 8 on the next page shows the oxygen concentration in the electrolyte for a pore saturation level of 0.8. The concentration is very low close to the rebar, indicating that the oxygen reduction kinetics should be mass transport limited for this pore saturation level. The concentration is lower toward the back of the rebar.
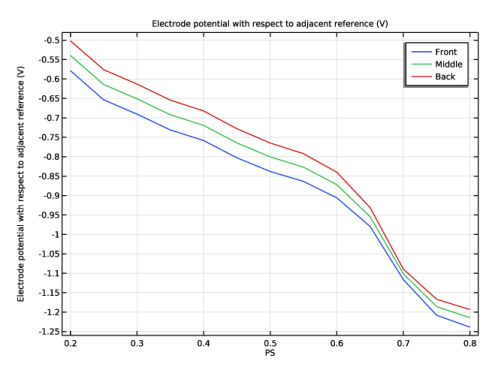
An important factor for the corrosion rate of the rebar is the operating electrode potential, which is the difference between the electric potential (here the potential applied by the potentiostat) and the electrolyte potential. Figure 9 on the next page shows the operating electrode potential for various pore saturation levels for three different points (front, middle, and back) of the rebar surface. The potential drops considerably at a pore saturation level of 0.65.
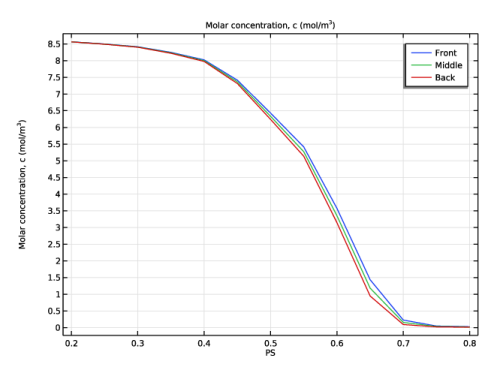
Figure 10 shows the local oxygen concentration at the rebar for various pore saturation levels. The concentration drops significantly toward higher saturation levels. This is an effect of the decreasing diffusivity of oxygen in the concrete for higher saturation levels.
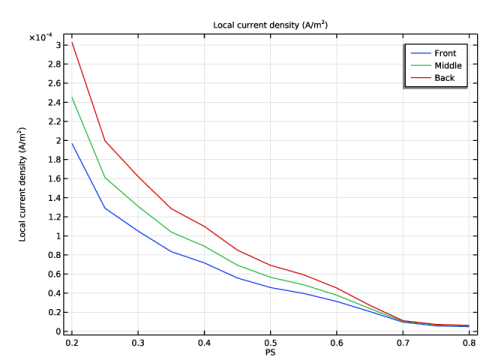
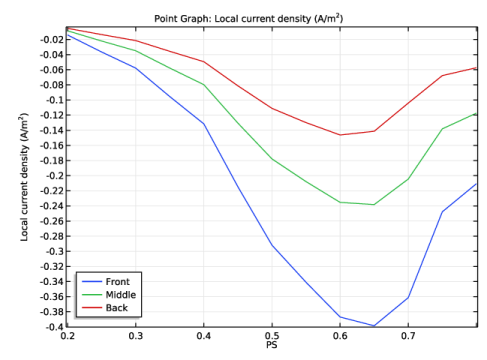
The local oxygen reduction current densities at the rebar are shown in Figure 11 on the next page. The magnitude of the reduction current is highest around a pore saturation level of 0.6–0.65. Up to this point the current densities are increasing due to increased electrolyte conductivity, but for higher pore saturation levels the current densities decrease due to decreased oxygen diffusivity.
The hydrogen evolution currents are shown in Figure 12 on the next page. Hydrogen evolution is very limited below a PS level of 0.65, which is the saturation level at which the electrode potential gets below the equilibrium potential (1.03 V) for the hydrogen evolution reaction, see
Figure 9.
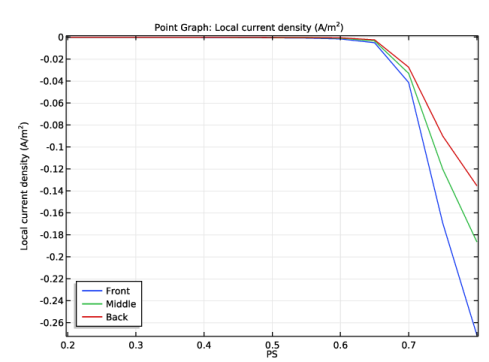
Finally, the iron oxidation currents are shown in Figure 13. Corrosion current densities are higher for low PS levels, which is in line with the higher electrode potential for low PS levels (
Figure 9). The magnitude of the iron oxidation current density is considerably smaller than the oxygen reduction and hydrogen evolution current densities at the steel rebar. This low magnitude indicates that the zinc coating applied onto the concrete is effective in protecting the steel rebar from being corroded.