To remove a breakpoint, click it again, press Ctrl+B again, or right-click the line number and choose Remove Breakpoint. All breakpoints can be removed in one action by using the
Remove All (

) button in the
Breakpoints section of the
Method ribbon tab. Sometimes, it is convenient to make the test run of an application ignore the existing breakpoints. In such a case, right-click the line number and choose
Disable Breakpoint or press Ctrl+Shift+B. You can also disable all breakpoints using the
Disable All (

) toggle button. Disabled breakpoints are indicated by an empty red circle when you disable individual breakpoints and with a diagonal black line when you disable all breakpoints. Press Ctrl+Shift+B again or click the
Disable All (

) button again to enable a single disabled breakpoint or to enable all breakpoints, respectively. You can also use the
Breakpoints window to manage the breakpoints; see
Viewing and Modifying All Breakpoints.
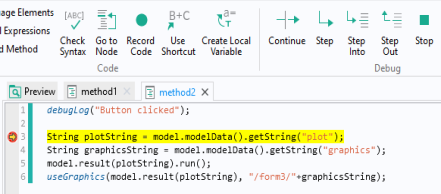
If you click the Continue button (or press F5), the method continues to run until it completes or reaches another breakpoint. If you click the
Step button (or press F6), the method continues to run until the next line, where it stops again, giving you the options to continue or step. The
Step Into button works in the same way as the
Step button. However, if the line contains a call to another method or utility method, clicking
Step Into (or pressing F7) then takes you to the first line in that method instead of continuing to the next line in the current method. Click
Step Out (or press Ctrl+F7) to step out from the current method. Click the
Break button (or press Pause) to suspend the current running method at the next reached line in method code, as if there had been a breakpoint there. There is also a
Stop button, which is available when you start to run a method. Clicking (or pressing Ctrl+Pause) it forces the current method to stop. It can be useful if you want to stop the debugging run immediately or if the method runs into an endless loop, for example.