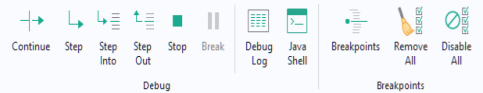
In the ribbon, the Debug and
Breakpoint sections contain the tools available for debugging methods.
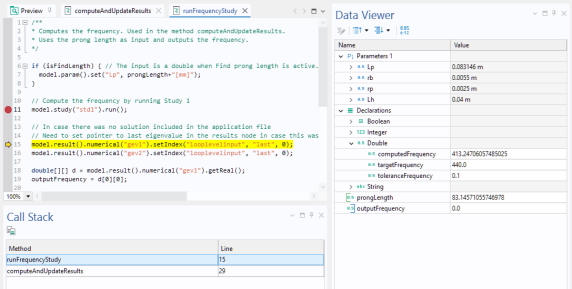
When you run the application, the method will stop at the breakpoints. Click the Step button in the ribbon to go to the next line in the method. The figure above shows a method currently stopped at the line highlighted in yellow. The
Data Viewer window, seen to the right in the figure above, opens when a method is paused at a breakpoint. Using the
Data Viewer window, you review and modify local variables, declarations, and parameters, while debugging.
The Call Stack window, below the method window, as seen in the figure above, also opens when a method is paused at a breakpoint. You can select a method in the call stack see the corresponding variables in the
Data Viewer window.
Click Continue to run the method up until the next breakpoint. Click
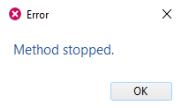
Stop to stop running the method and exit. You can also stop the execution of a method while testing an application by using the keyboard shortcut Ctrl+Pause. A dialog appears, as shown below.
Click Break to suspend method execution at the next reached line in method code, as if there had been a breakpoint there. Click
Step Into to step into the next method, if possible. The option
Step Out continues until the current method returns. Use
Remove All to remove all breakpoints. Instead of removing, you can disable all breakpoints by clicking
Disable All.
To get an overview of all breakpoints, you can open the Breakpoints window, as seen in the figure below. To open this window, click the corresponding button in the
Method tab, in the ribbon section
Breakpoints.
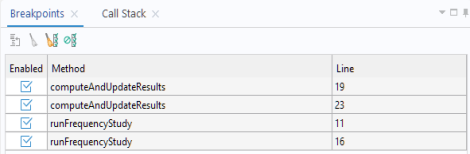
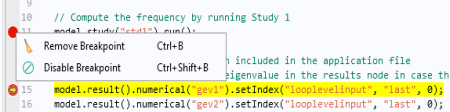
You can enable and disable individual breakpoints, either from the Breakpoints window or by right-clicking a breakpoint in the gray column to the left of the code line numbers, as shown below.
Click the Debug Log to display customized debugging messages in a separate
Debug Log window, as shown in the figure below.
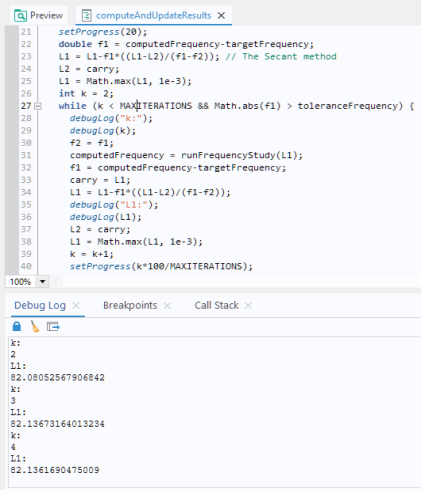
The example above illustrate that, as an alternative to using the Data Viewer window, you can use the
debugLog command a to display the values of variables in the
Debug Log window. The code below uses the
debugLog command to display the values of strings and components of a 1D double array.
From COMSOL version 6.4 onward, any output produced by System.out or
System.err in method code will be displayed in the
Debug Log window, for example: