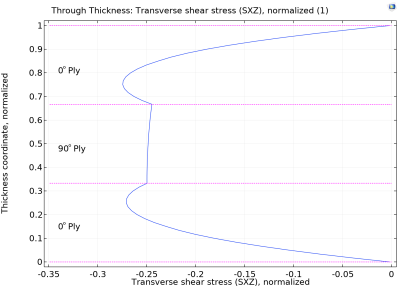
To this end, you can use a Through Thickness plot in which any quantity can be plotted against laminate thickness. You can select one or more geometric points on the boundary, or optionally create cut point datasets. It is also possible to specify point coordinates directly.
The result quantity is plotted on the x-axis, and the thickness coordinate is plotted on the
y-axis. An example of a through-thickness plot is shown in
Figure 2-29.