|
1
|
|
2
|
In the Settings window for 1D Plot Group, type Equilibrium Curve in the Label text field.
|
|
3
|
Locate the Plot Settings section and select the x-axis label checkbox. In the associated text field, type Liquid ethanol mole fraction (x1).
|
|
4
|
Select the y-axis label checkbox. In the associated text field, type Vapor ethanol mole fraction(y1).
|
|
4
|
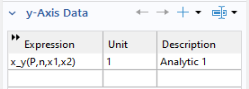
In the table, type x_y(P,n,x1,x2).
 Alternatively click Replace Expression Alternatively click Replace Expression |