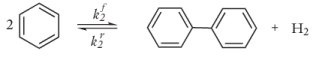
Here the reference concentration is 1 mol/m3. At the same time, biphenyl is reversibly formed from benzene:
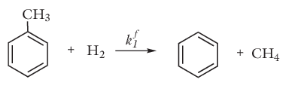
The chemical reactions given in Equation 1 and
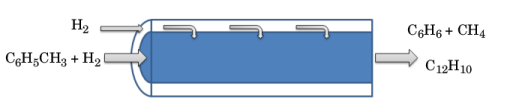
Equation 2 suggest that maintaining high concentration of hydrogen would be beneficial to ensure a high benzene yield. Such process conditions can be achieved by using a membrane reactor. As illustrated schematically in
Figure 1, hydrogen can be supplied continuously across the porous membrane.
where F is the molar flow rate in the reactor,
V is the reactor volume,
R is the species rate expression, and
f is the molar flow rate per unit volume (SI unit: mol/(m
3·s)) across the membrane. The velocity of the hydrogen gas across the porous membrane can be described by Darcy’s law:
where K is a proportionality constant,
pshell is the gas pressure on the shell side of the membrane, and
preactor the pressure on the reactor side. The molar flow rate per unit volume across the membrane then becomes
Above, a is the membrane surface area per unit volume, and
cshell is the concentration of hydrogen on the shell side.
In Equation 4,
Cmix represents the mixture (reacting system) molar heat capacity, and
Q denotes the heat due to chemical reaction:
where Hj is the heat produced by reaction
j, calculated from
In Equation 5,
hi represents the species partial molar enthalpy and
νij the stoichiometric coefficients.
The Reaction Engineering interface automatically sets up and solves Equation 3 and
Equation 4 when you select the predefined plug-flow reactor type. To adjust the default model to account for hydrogen entering the reactor through the membrane, the flow term
fH2 has to be specified and included in the material balance for hydrogen.
Solving the energy balance, Equation 4, requires the input of mixture molar heat capacity
Cmix, and the partial molar enthalpies,
hi, of the reacting species. In this example, these thermodynamic properties are calculated from the property package.
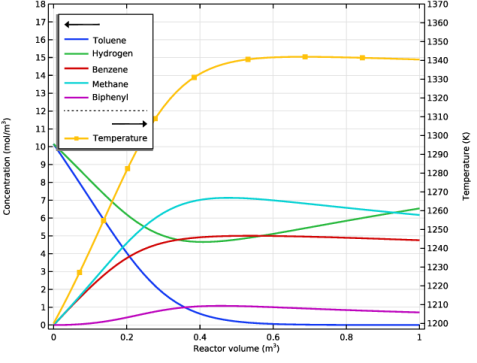
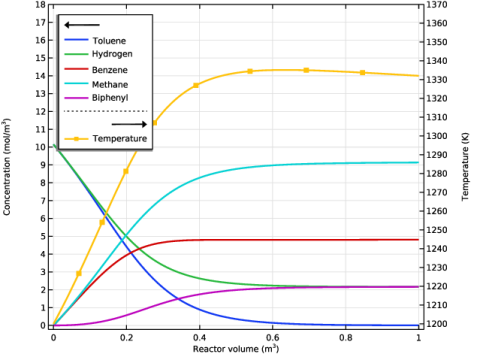
A second model simulates the membrane reactor, with a continuous supply of hydrogen through the membrane. Figure 3 shows the corresponding concentration distributions. The biphenyl concentration is reduced versus that obtained from the first model. Clearly, the membrane reactor produces benzene with greater selectivity.