|
5
|
|
2
|
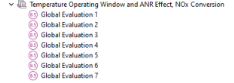
In the Settings window for Evaluation Group, type Temperature Operating Window and ANR Effect, NOx Conversion in the Label text field.
|
|
1
|
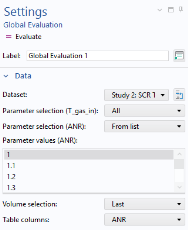
In the Label text field, type ANR = 1.0.
|
|
2
|
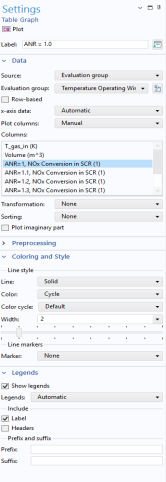
In the Settings window for Table Graph, type ANR = 1.1 in the Label text field.
|
|
2
|
In the Settings window for Table Graph, type ANR = 1.2 in the Label text field.
|
|
5
|
In the Settings window for 1D Plot Group, type NOx Conversion in SCR in the Label text field.
|
|
7
|
Select the y-axis label checkbox. In the associated text field, type NOx Conversion in SCR (1).
|
|
3
|
In the Settings window for Evaluation Group, type Temperature Operating Window and ANR Effect, NH3 Conversion in the Label text field.
|
|
3
|
In the Settings window for 1D Plot Group, type NH3 Conversion in SCR in the Label text field.
|
|
5
|
Select the y-axis label checkbox. In the associated text field, type NH<sub>3</sub> Conversion in SCR (1).
|
|
9
|
|
3
|
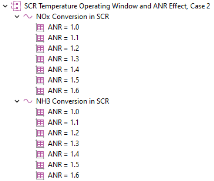
In the Settings window for Group, type SCR Temperature Operating Window and ANR Effect, Case 2 in the Label text field.
|