Results for Study 1
Take a look at the resulting default plots. Modify them and follow the below steps to create Figure 3, Figure 4, and Figure 5.
Figure 3: Conversion Along Reactor Axis
1
In the Settings window for 1D Plot Group, type Conversion Along Reactor Axis in the Label text field.
2
3
4
5
6
7
8
9
10
11
12
13
14
The plot in Figure 3 has now been set up. Duplicate this plot group to use as a basis for setting up Figure 4.
Figure 4: Temperature Increase Along Reactor Axis
1
2
3
In the Settings window for 1D Plot Group, type Temperature Increase Along Reactor Axis in the Label text field.
4
5
6
7
8
By using an Evaluation Group we can create a table containing the final conversion values for each run in the Parametric Sweep study. That table can then be plotted to give Figure 5. That is what we will do next.
Figure 5: Temperature Operating Window
1
2
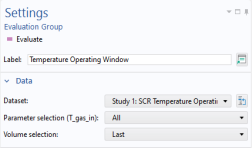
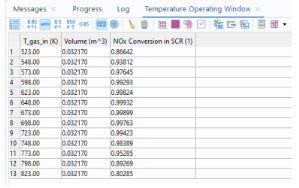
In the Settings window for Evaluation Group, type Temperature Operating Window in the Label text field.
3
4
5
6
7
8
9
10
11
12
13
14
15
16
In the Settings window for 1D Plot Group, type Temperature Operating Window in the Label text field.
17
18
SCR Temperature Operating Window, ANR = 1.3, Case 2
For convenience, add the plot groups to a Group with a descriptive name.
1
2
3
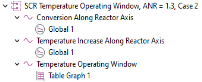
In the Settings window for Group, type SCR Temperature Operating Window, ANR = 1.3, Case 2 in the Label text field.
4
Figure 3, Figure 4, and Figure 5 are now done. Continue by investigating the SCR operation as a function of both inlet temperature and ammonia to NOx ratio (ANR). Such a study will generate a lot of data due to the many parameter combinations. Therefore, turn off generate default plots, choose Only plot when requested, and limit the data stored.