This tutorial model presents a detailed description of how to set up a model of a catalytic reactor for exhaust gas treatment. The example shows an application of the modeling strategy, described in the section Chemical Reaction Engineering Simulations and demonstrates through a series of simulations how an understanding of the catalytic reactor and its system can be improved. To do this, it uses a number of the interfaces and features found in the Chemical Reaction Engineering Module. Transport and thermodynamic properties are provided by the Thermodynamics feature under Global Definitions.
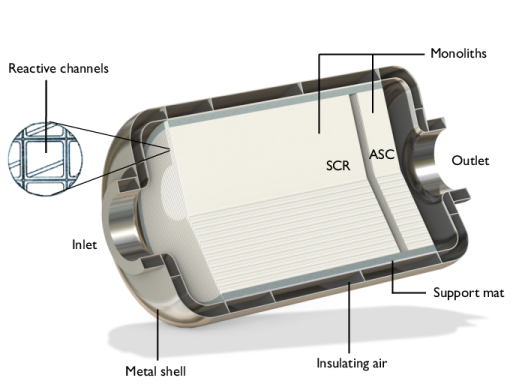
The system to be modeled is the selective reduction of harmful nitrogen oxides NOx (NO and NO2) into nitrogen (N
2) in an exhaust gas after-treatment system of a heavy-duty diesel truck. The nitrogen oxides are reduced by ammonia that is injected upstream of the after-treatment system consisting of a catalytic, monolithic reactor.
In both of the beds there are unwanted side-reactions. In the first bed, NH3 may react with oxygen instead of reducing NOx. This means that the amount of injected ammonia must exceed the amount of NOx, while not being so excessive as to release NH
3 to the atmosphere. In the second bed, ammonia should get oxidized into nitrogen, but may instead react to form NOx. This is another reason to try and keep the injected amount of ammonia to a minimum.
The goals of the simulations are to find the optimal dosing of NH3, and to investigate the influence of engine load on the system. The engine load affects the gas temperature, amount of NOx, and mass flow rate of the exhaust gas.

You may want to revisit the flowchart in Figure 1 to follow the modeling strategy for this model as described next.
Except for the homogeneous gas phase equilibrium reaction (4), all reactions are heterogeneous catalytic reactions with reaction rates that depend on surface coverage. The surface coverage of ammonia can be related to the fluid phase concentration by assuming that ammonia desorption and adsorption are in equilibrium. With a Langmuir-Hinshelwood mechanism, based on this assumption, global rate expressions can be derived. The following five rate expressions have been suggested in
Ref. 1:
Here, KNH3 is the ammonia adsorption equilibrium constant, expressed with the pre-exponential factor
KNH3,523, and the adsorption enthalpy
ΔHads:
Here, G is a variable that accounts for the inhibition effects caused by adsorption of other species on the surface:
where Ki (i=1-4) follows an Arrhenius-type expression
Reaction 7 and
8 are the same chemical equations as Reaction
5 and
6, but since the catalyst is different, the kinetic parameters differ. The rate expressions are assumed the same though. The rate expression for Reaction
9 is:
(10) .
.
The competing chemical reactions raise the issue of optimal dosing of NH3 to handle the reduction process in the first bed. Stoichiometry suggests a 1:1 ratio of NH
3 to NO as a lower limit for the standard SCR reaction. Due to the undesired oxidation of ammonia it is likely that a stoichiometric excess of NH
3 is necessary. The excess ammonia will be converted in the second ammonia-slip catalyst bed. The NOx forming side reactions in the second bed motivates as low ammonia injection as possible. This is also important for economic and pressure-drop reasons.
To find the minimal level of NH3 required to reduce the NOx present in the exhaust gas requires a reactor model accounting for changing reactant concentrations and system temperature.
(11) ,
,
where Fi is the species molar flow rate (SI unit: mol/s),
V represents the reactor volume (SI unit: m
3), and
Ri is the species net reaction rate (SI unit: mol/(m
3·s)).
The molar flow rate is related to the species concentrations, ci (SI unit: mol/m
3), through the volumetric flow rate,
v (SI unit: m
3/s):
(12) ,
,
where the volumetric flow rate is given by the average flow velocity, u (SI unit: m/s), multiplied by the reactor cross-section
A (SI unit: m
2):
(13) .
.
(14) ,
,
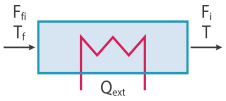
where Cp,i is the species molar heat capacity (SI unit: J/(mol·K)), and
Qext is the heat added to the system per unit volume (SI unit: J/(m
3·s)).
Q denotes the heat due to chemical reaction (SI unit: J/(m
3·s)):
where Hj the heat of reaction (SI unit: J/mol), and
rj the reaction rate (SI unit: mol/(m
3·s)). The
Qext is set to zero, based on the assumption that the modeled channel is close to the center of the monolith, and that the reactor is well insulated.
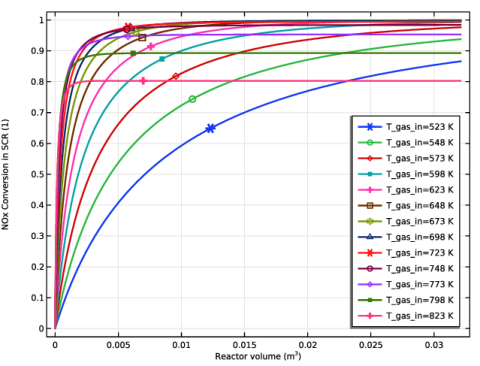
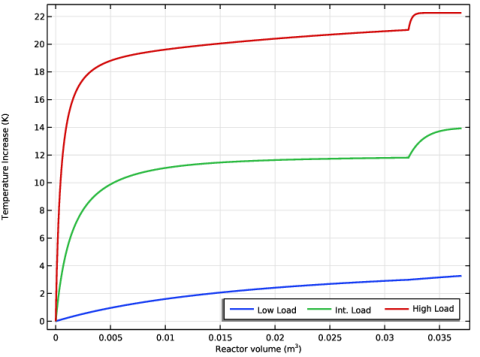
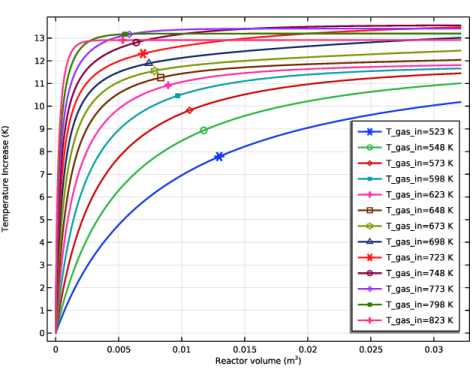
Figure 4 shows the temperature increase in the first bed along the reactor axis. The exothermic reactions create a temperature increase. For the four highest temperatures the outlet temperature has decreased. This is a result of the different selectivity in the system at different temperatures,
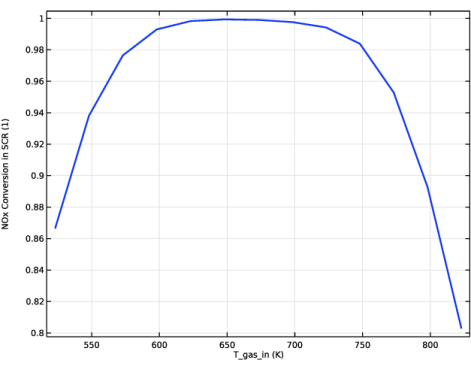
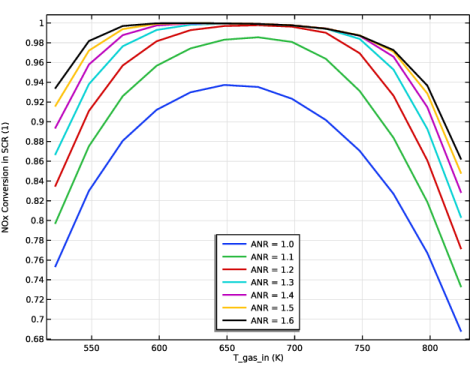
Moving on to investigate the influence of both inlet temperature and ammonia-to-NOx ratio (ANR). Figure 6 shows that for an increased ANR, the operating window widens and shifts toward lower temperatures. In addition, the conversion of NOx increases for the investigated range.
The conversion of ammonia as a function of ANR and inlet gas temperature is seen in Figure 7. Complete conversion of ammonia is reached for all ANR at inlet gas temperatures above 750 K.
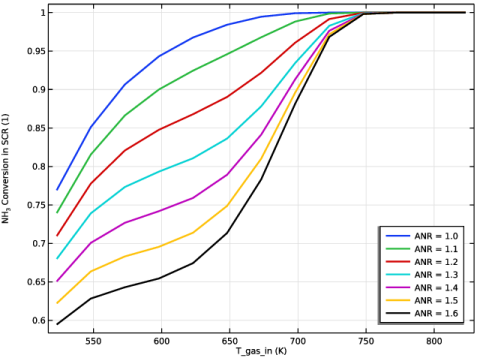
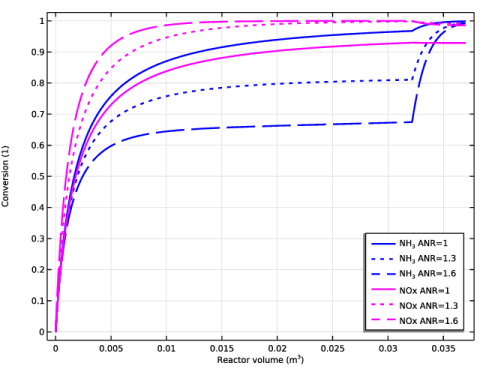
Figure 9 shows the conversion in the dual bed single channel system for each of the three engine load cases.
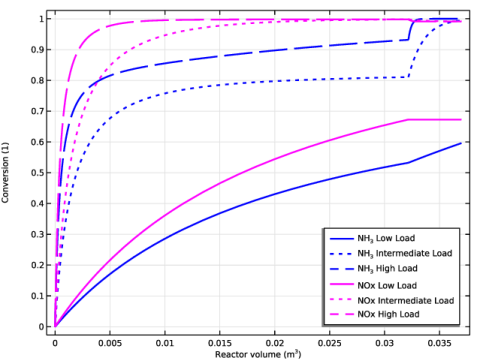
It is clear that temperature plays a central role in affecting the optimal dosing of NH3. Since the temperature distribution is likely to vary from channel to channel in a monolith reactor, a space-dependent reactor model accounting for this variation is called for. Based on the single channel model simulations, a NH
3:NOx ratio of 1.3 appears appropriate for the extended model.
It is clear from the Single Channel Model that temperature plays a central role in affecting the optimal dosing of NH3. As the temperature distribution is likely to vary from channel to channel in a catalytic converter, a full monolithic reactor model is required.
(15)
In Equation 15,
Di denotes the diffusion coefficient (SI unit: m
2/s),
ci is the species concentration (SI unit: mol/m
3), and
u equals the velocity vector (SI unit: m/s). The term
Ri (SI unit: mol/(m
3·s)) corresponds to the species’ rate expression.
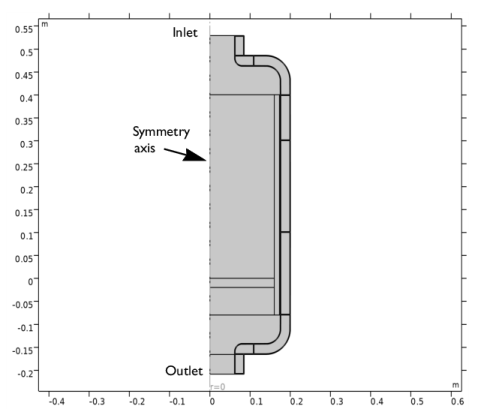
Mass transport is only allowed in the direction of the channels, corresponding to direction of the z-axis in the 2D-axisymmetric geometry used in this example. For the diffusive transport, this is accomplished by setting the
x and
y-components of the diffusivity matrix to zero. The pressure-driven flow in the monolith is also defined in the direction of the
z-axis, hereby restricting the convective mass transport to the channel direction as well. Each monolith channel thus behaves as a 1D plug flow model with included diffusion. These separate channel models are connected through the heat transfer equations for the reactor monolith.
(16)
(17)
The monolith is treated as a porous matrix with the effective permeability κ (SI unit: m
2). Similarly to the diffusivity, the
x- and
y-components of the permeability matrix are set to zero. The density,
ρ (SI unit: kg/m
3), and viscosity,
μ (SI unit: Pa·s), of the gas are assumed to be well represented by the temperature-dependent properties of nitrogen, as only relatively small concentrations of other gases are present.
(18)
(19)
where ρf (SI unit: kg/m
3) is the fluid density,
Cpf (SI unit: J/(kg·K)) is the fluid heat capacity, and
keff (SI unit: W/(m·K)) is the equivalent thermal conductivity. Furthermore,
u (SI unit: m/s) is the fluid velocity field derived by the fluid flow interface.
Q (SI unit: W/m
3) is the heat source due to exothermic chemical reactions:
(20) .
.
Above, Hj (SI unit: J/(mol·K)) is the heat of reaction for reaction
j, and
rj is the reaction rate for said reaction.
The effective conductivity of the solid-fluid system, keff, is related to the conductivity of the solid,
ks, and to the conductivity of the fluid,
kf, by:
(21) .
.
In Equation 21,
Θs denotes the solid material’s volume fraction, which is related to the volume fraction of the fluid
Θf by:
(22) .
.
Equation 19 is the equation set up by the Heat Transfer interface for a fluid domain. For the solid monolith, only heat transfer by conduction applies:
(23) ,
,
where ks (SI unit: W/(m·K)) is the thermal conductivity for the solid walls. For the extruded monolith material, the thermal conductivity is anisotropic.
The heat transfer in the porous support mat is also described by Equation 19 and
23. Contrary to the monoliths, the support mat has isotropic thermal conductivity. The same is true for the solid metal walls in the reactor.
is used at the inlet of the first bed. ΔH (SI unit: J/(kg)) is the sensible enthalpy.
where h (SI unit: W/(m
2·K)) denotes the heat transfer coefficient, and
Tamb (K) equals the ambient temperature.
Accurate thermodynamic data is required as input to energy balance equations, both in the Single Channel Model (plug flow model, (Equation 14)) and the Monolith Reactor Model (
Equation 19). In addition to thermodynamic properties, the model equations also require transport properties to describe the space-dependent reactor model.
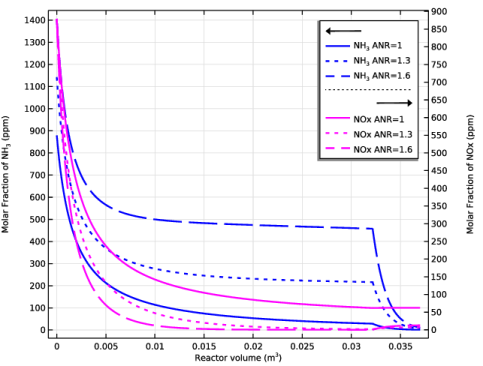
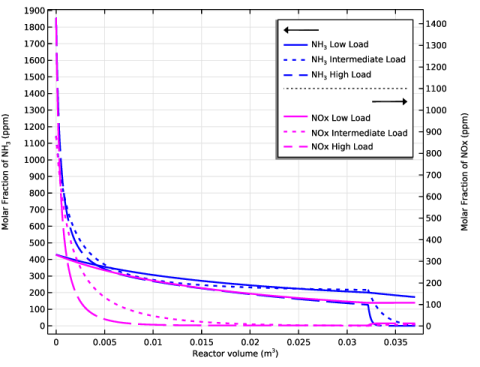
Figure 13 shows the molar fraction of NH
3, NO, and NO
2 in the two catalyst beds for the low engine load case. The effect of the radial temperature gradient is clearly visible as the conversion decreases close to the edge. The temperature for the low engine load case is below the optimal temperature for the SCR reactor, see
Figure 5. The low temperature results in low conversion of both NOx and ammonia.

Figure 14 illustrates the result for the intermediate engine load case. At this increased temperature, the conversion increases in the reactor. Higher mass flow rate and higher heat source due to increased conversion, gives smaller radial temperature gradient.

Figure 15 shows the results for the high engine load case..

Figure 16 illustrates the gas velocity, pressure, and temperature in the beds for the highest engine load.

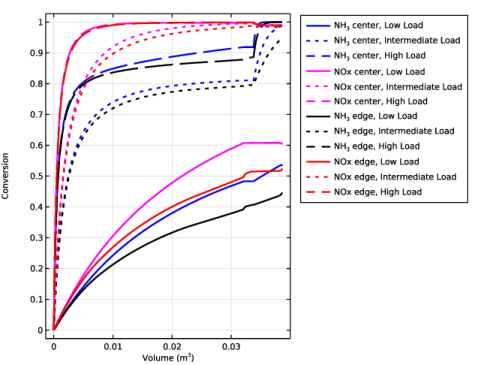
The effect of temperature on conversion is seen in Figure 17. In this figure, the conversion is plotted both along the central symmetry axis, and along the edge of the monoliths. For a high engine load, the conversion does not vary significantly with the position in the reactor, but for lower engine loads, the conversion differs significantly.
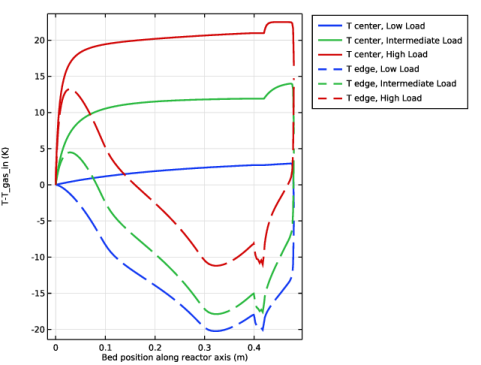
The temperature differences along the reactor axis, at the center of the reactor, and at the edge of the beds, are seen in Figure 18. Close to the inlet of the first bed, the temperature increases both at the center and along the SCR edge. This is due to the exothermic reactions. After the first rapid temperature increase, the increase in temperature is slower, and at the edge of the first bed, the temperature instead decreases due to heat flux to the surroundings. For the high and intermediate engine load cases, the slip of ammonia from the first bed creates a significant temperature increase when this ammonia is oxidized in the second bed. For the low engine case, the activity is too low to create a temperature increase. At the bed edge, the heat flux to the surrounding decreases the temperature in the first bed, decreasing the ammonia conversion rate, which creates an even larger temperature increased during ammonia oxidation in the second bed.
From the results in Table 1 it is clear that for an ammonia-to-NOx ratio of 1.3, the exhaust gases from the truck will contain the least ammonia at high load, and the least NOx at intermediate load.
This study revealed that the ammonia-to-NOx ratio should be varied with engine load. A reactant ratio NH3:NO of approximately 1.3 is found to be close to optimal for an intermediate engine load, but at higher loads this ratio could be decreased. At low engine load, the temperature is too low to give acceptable NOx reduction.