Results
Two plots are automatically created, one slice plot for the velocity and one pressure surface plot on the wall.
Velocity (spf)
1
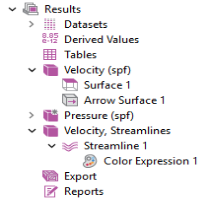
In the Model Builder under Results
, expand the Velocity (spf)
node.
2
Right-click Multislice
and choose Delete. Click Delete to confirm.
3
Go to the Velocity (spf) toolbar and click Surface
.
-
On the Velocity (spf) toolbar, click Arrow Surface
.
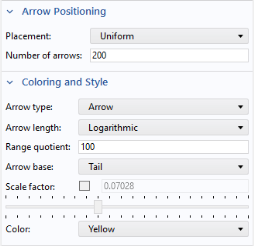
4
Go to the Settings window for Arrow Surface.
-
Locate the Coloring and Style section. From the Arrow length list, select Logarithmic.
-
From the Color list, select Yellow. Click the Plot button
followed by the Zoom Extents button
in the Graphics window toolbar.
The plot in
Figure 8
displays in the Graphics window.
To see the recirculation effects, create a streamline plot of the velocity field.
3D Plot Group 3
1
In the Home toolbar click Add Plot Group
and choose 3D Plot Group
.
2
In the Settings window for 3D Plot Group 3, type
Velocity, Streamlines
in the Label text field.
3
Go to the Velocity, Streamlines toolbar and click Streamline
.
4
In the Streamline Settings window, scroll to the Selection section, and select Boundary 1 (the inflow boundary) only.
5
In the Settings window for Streamline locate the Coloring and Style section. From the Line type list, choose Tube.
6
Right-click Streamline 1
and choose Color Expression
.
The plot in
Figure 9
displays in the Graphics window.