|
1
|
|
2
|
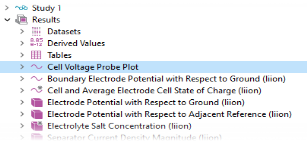
In the Settings window for 1D Plot Group, type Cell Voltage Probe Plot in the Label text field.
|
|
2
|
 Plot.
Plot.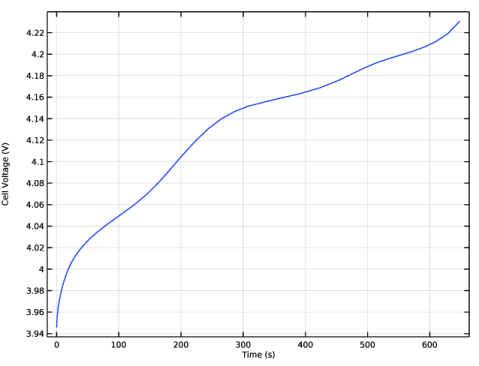
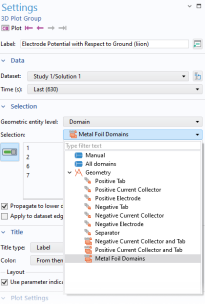
 Disable
 Plot to inspect the negative current collector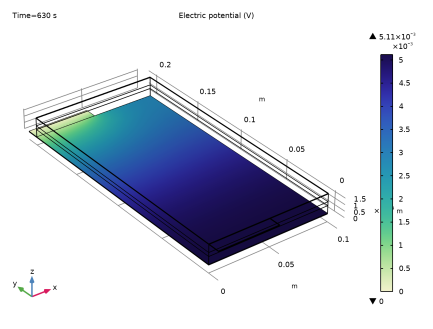
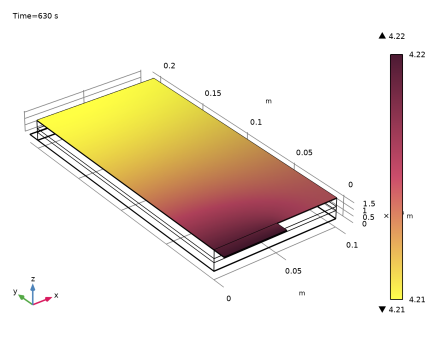
 Plot to inspect the positive current collector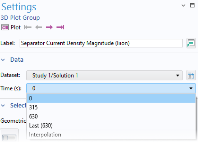
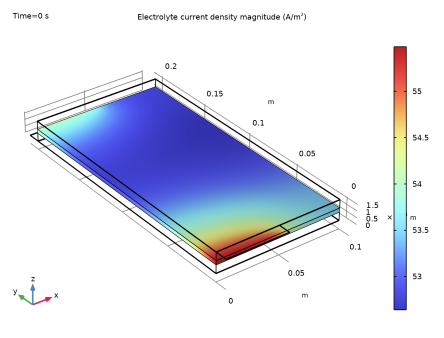
 Plot to inspect the current density a the beginning of the simulation
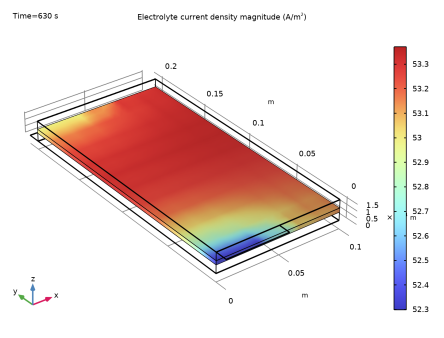
 Plot to inspect the current density a the beginning of the simulation