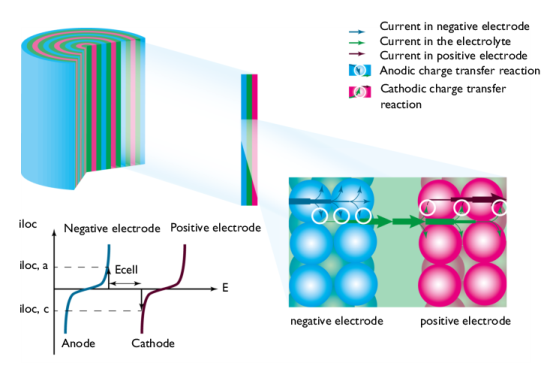
Figure 2 shows a schematic picture of a typical discharge process.
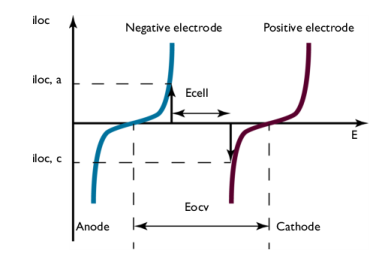
Looking closer at the charge transfer reactions on both electrode interfaces, Figure 3 describes the polarization of the electrodes during discharge. The graph plots the charge transfer current density,
iloc, as a function of the electrode potential,
E.
The negative electrode is polarized anodically during discharge, a positive current as indicated by the arrow in Figure 3. The potential of the negative electrode subsequently increases. The charge-transfer reaction involves oxidation of either the electrode material or of reactants in the electrolyte. The shape of the polarization curve is governed by the electrode kinetics for the specific materials. The resulting local current density is denoted i
loc, a.
Figure 3 also shows that the potential difference between the electrodes, here denoted
Ecell, decreases during discharge compared to the open cell voltage, here denoted
Eocv. In this description losses in
Ecell through ohmic resistance and mass transport in electrolyte and electrode particles were neglected. Both effects may occur in many batteries and can be included in a model with the Battery Design Module functionalities.
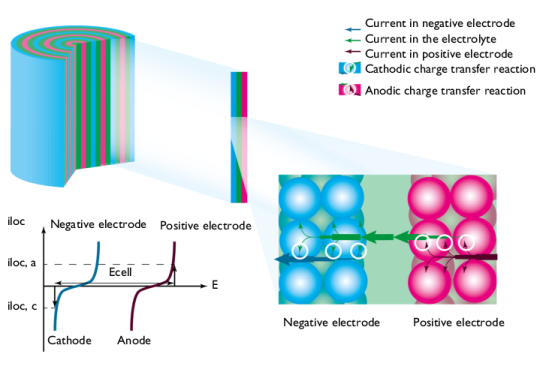
Figure 4 shows the reversed processes in the battery during charge. Electric energy is transformed to chemical energy stored in the battery.
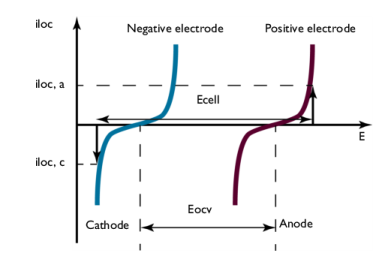
Figure 5 depicts the polarization of the electrodes during charge.
During charge, the cell voltage Ecell is higher than the open circuit voltage
Eocv.