|
2
|
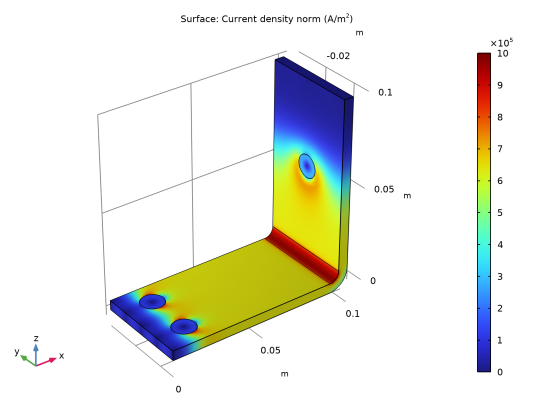
In the Settings window for 3D Plot Group, type Current Density in the Label text field.
|
|
4
|
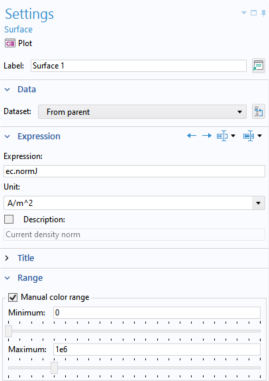
In the Settings window for Surface, click Replace Expression in the upper-right corner of the Expression section. From the menu, choose Component 1 (comp1) > Electric Currents > Currents and charge > ec.normJ - Current density norm - A/m². You can also type ec.normJ in the Expression field when you know the variable name or, alternatively, use the auto completion functionality by typing norm and then pressing Ctrl+Space to get a variable name suggestion.
|
|
3
|
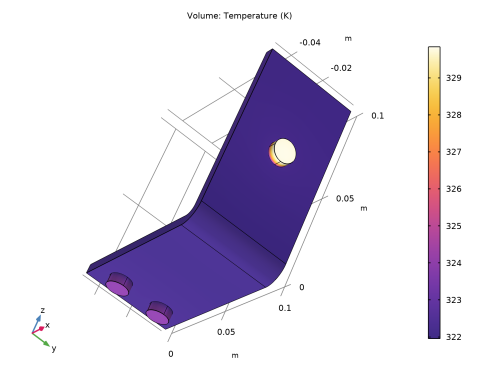
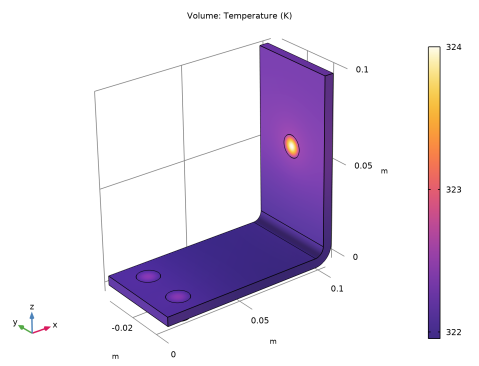
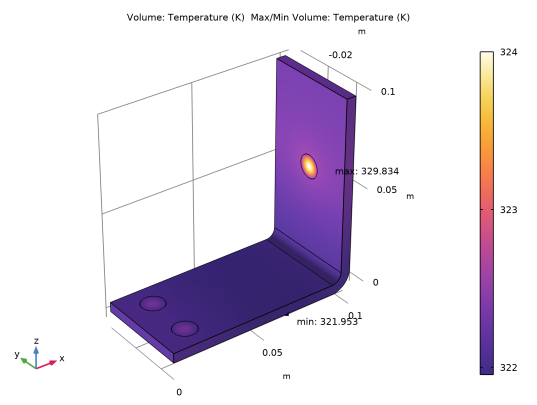
In the Settings window for Max/Min Volume, click Replace Expression in the upper-right corner of the Expression section. From the menu, choose Component 1 (comp1) > Heat Transfer in Solids > Temperature > T - Temperature - K. You can also search for Temperature in the search field above the tree of variables or manually enter T.
|
|
3
|
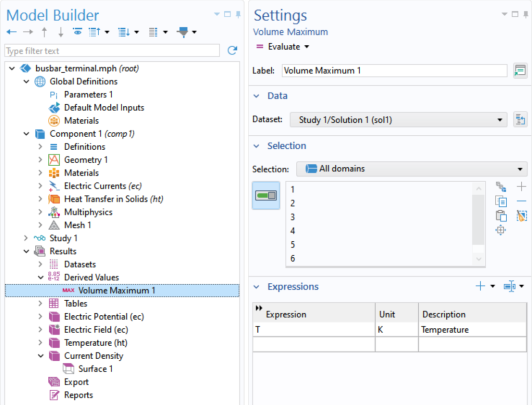
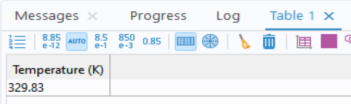
In the first row of the Expression table, enter T (unless it is automatically filled out) for the temperature and click Evaluate at the top of the Settings window.
|