Datasets and Selections
By adding Selections and adjusting the Datasets under the Results node you can create more interesting plots.
1
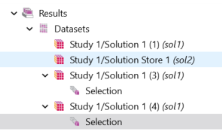
In the Model Builder, expand the Results > Datasets node. Right-click Study 1/Solution 1
and choose Duplicate
.
2
Right-click Study 1/Solution 1 (3)
and choose Selection. A Selection node is added to the Model Builder.
3
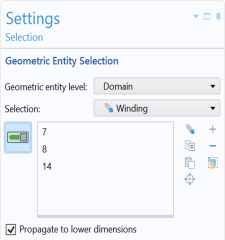
Go to the Settings window for Selection. Under Geometric entity selection:
-
From the Geometric entity level list, select Domain.
-
From the Selection list, select Winding.
4
Right-click Study 1/Solution 1 (1)
and choose Duplicate
.
5
Right-click Study 1/Solution 1 (4)
and choose Selection. A Selection node is added to the Model Builder.
6
Go to the Settings window for Selection. Under Geometric Entity Selection:
-
From the Geometric entity level list, select Domain.
-
From the Selection list, select Core.
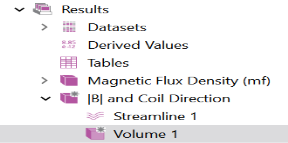
|B| and Coil Direction
1
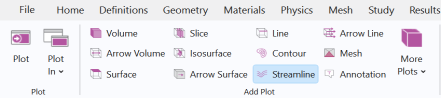
In the Results toolbar, click 3D Plot Group
.
An additional toolbar containing Plot Tools for the 3D Plot Group appears when the 3D Plot Group is selected in the Model Builder. Rename
3D Plot Group 2
as
|B| and Coil Direction
by typing the new name in the Label text field.
2
On the |B| and Coil Direction toolbar, click Streamline
.
3
Go to the Settings window for Streamline. Click Replace Expression
in the upper-right corner of the Expression section. From the menu, choose Component 1 > Magnetic Fields > Coil parameters > mf.coil1.eCoilx,...,mf.coil1.eCoilz - Coil direction.
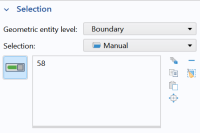
4
Under Selection, click the Paste Selection button
and enter
58
in the Selection text field.
5
Click OK
6
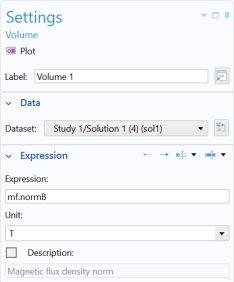
Right-click |B| and Coil Direction
and choose Volume
.
A Volume 1 node is added to the Model Builder.
7
Go to the Settings window for Volume. Under Data from the Dataset list, select Study 1/Solution 1 (4).
8
Go to the Settings window for Volume. Under Coloring and Style, select a color table. Choose the color table Prism from the Rainbow category in the color table tree.
9
Double-click to select the color table.
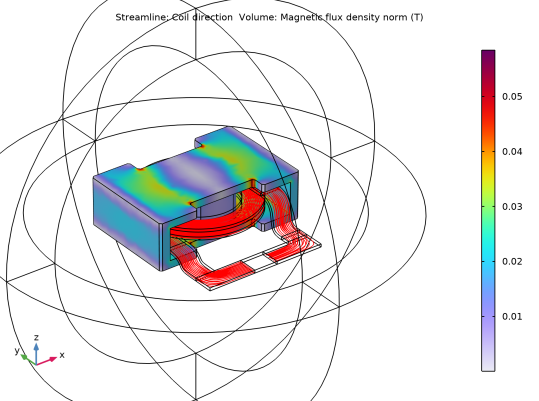
10
Click the Plot
button.
In the Graphics window toolbar, click the Zoom In
button once. Click also the Show Grid
button to toggle off the grid.