|
|
|
|
1
|
|
2
|
In the Select Physics tree, select Acoustics > Ultrasound > Nonlinear Pressure Acoustics, Time Explicit (nate).
|
|
3
|
Click Add.
|
|
4
|
Click
|
|
5
|
|
6
|
Click
|
|
1
|
|
2
|
|
3
|
Click
|
|
4
|
Browse to the model’s Application Libraries folder and double-click the file hifu_tissue_sample_parameters.txt.
|
|
1
|
|
2
|
|
3
|
|
4
|
|
5
|
|
1
|
|
2
|
|
3
|
|
4
|
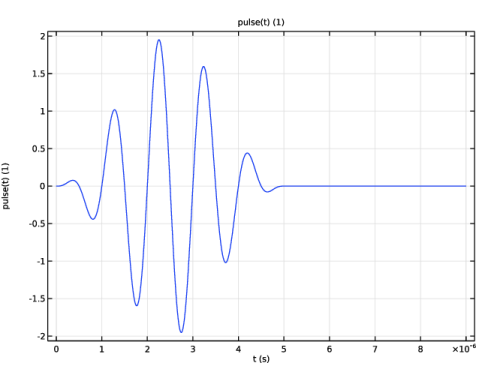
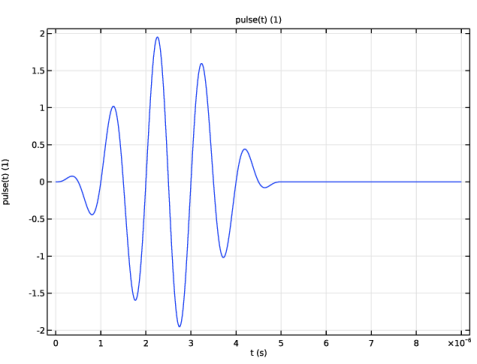
Locate the Definition section. In the Expression text field, type sin(omega0*t)*(1 - cos(omega0*t/5))*rect1(t).
|
|
5
|
|
6
|
Locate the Units section. In the table, enter the following settings:
|
|
7
|
|
8
|
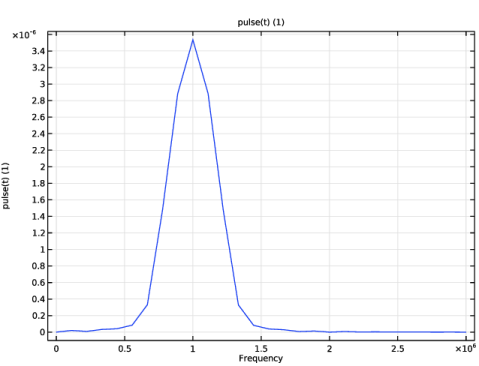
Locate the Plot Parameters section. In the table, enter the following settings:
|
|
9
|
Click
|
|
1
|
|
1
|
|
2
|
|
3
|
|
4
|
|
5
|
|
6
|
Select the Frequency range checkbox.
|
|
7
|
|
8
|
|
1
|
|
2
|
|
3
|
|
1
|
|
2
|
|
3
|
|
4
|
|
5
|
Click
|
|
1
|
|
2
|
|
3
|
|
4
|
|
5
|
Click
|
|
1
|
|
2
|
Click in the Graphics window and then press Ctrl+A to select both objects.
|
|
3
|
|
1
|
|
2
|
|
3
|
|
4
|
|
5
|
|
6
|
Click to expand the Layers section. In the table, enter the following settings:
|
|
7
|
Select the Layers to the right checkbox.
|
|
8
|
Clear the Layers on bottom checkbox.
|
|
9
|
Select the Layers on top checkbox.
|
|
10
|
Click
|
|
11
|
|
1
|
|
2
|
|
3
|
|
4
|
|
5
|
|
6
|
Locate the Layers section. In the table, enter the following settings:
|
|
7
|
Select the Layers to the right checkbox.
|
|
8
|
Clear the Layers on bottom checkbox.
|
|
9
|
Click
|
|
1
|
|
2
|
On the object fin, select Boundary 3 only.
|
|
3
|
|
1
|
|
2
|
|
3
|
|
1
|
In the Model Builder window, expand the Domain Point Probe 1 node, then click Point Probe Expression 1 (ppb1).
|
|
2
|
|
3
|
|
1
|
|
2
|
|
3
|
|
4
|
|
1
|
|
2
|
|
3
|
|
1
|
|
3
|
|
4
|
|
1
|
In the Model Builder window, under Component 1 (comp1) > Nonlinear Pressure Acoustics, Time Explicit (nate) click Nonlinear Pressure Acoustics, Time Explicit Model 1.
|
|
2
|
In the Settings window for Nonlinear Pressure Acoustics, Time Explicit Model, locate the Pressure Acoustics Model section.
|
|
3
|
|
1
|
|
1
|
|
3
|
|
4
|
|
1
|
|
1
|
|
1
|
In the Model Builder window, under Component 1 (comp1) right-click Materials and choose Blank Material.
|
|
2
|
|
4
|
Locate the Material Contents section. In the table, enter the following settings:
|
|
1
|
|
2
|
|
4
|
Locate the Material Contents section. In the table, enter the following settings:
|
|
1
|
|
2
|
|
3
|
|
5
|
|
6
|
Locate the Element Size Parameters section.
|
|
7
|
|
1
|
|
2
|
|
3
|
|
5
|
|
6
|
Locate the Element Size Parameters section.
|
|
7
|
|
8
|
Click
|
|
1
|
|
2
|
|
3
|
|
4
|
Click to expand the Adaptation section. From the Adaptive mesh refinement list, choose Adaptive mesh refinement.
|
|
5
|
Find the Mesh element control subsection. From the Adaptation method list, choose General modification.
|
|
1
|
|
2
|
|
3
|
|
4
|
|
5
|
|
6
|
In the Model Builder window, expand the Study 1 > Solver Configurations > Solution 1 (sol1) > Time-Dependent Solver 1 node, then click Adaptive Mesh Refinement.
|
|
7
|
|
8
|
Clear the Allow coarsening checkbox.
|
|
9
|
Locate the Error Estimation section. In the table, enter the following settings:
|
|
10
|
|
1
|
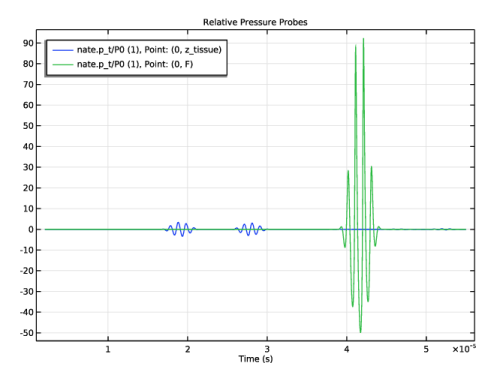
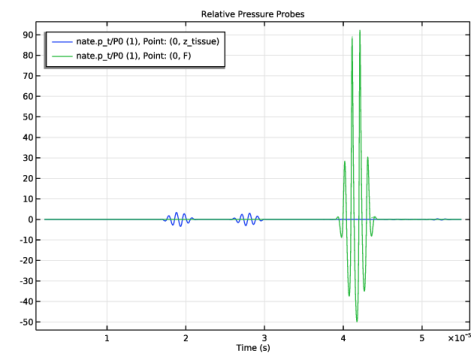
In the Model Builder window, expand the Results > Probe Plot Group 2 node, then click Probe Plot Group 2.
|
|
2
|
|
3
|
|
4
|
|
1
|
|
2
|
|
1
|
|
2
|
|
3
|
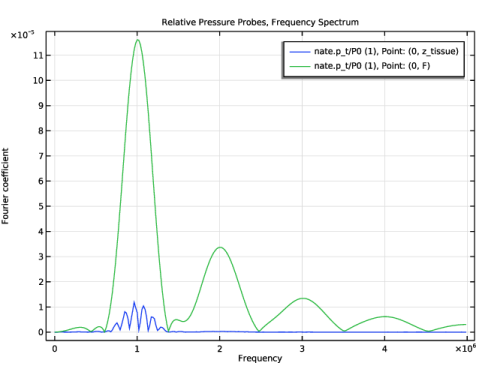
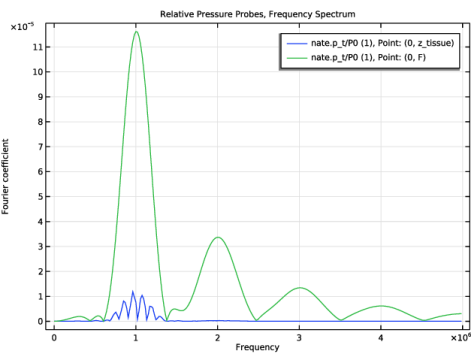
In the Settings window for 1D Plot Group, type Relative Pressure Probes, Frequency Spectrum in the Label text field.
|
|
4
|
|
1
|
|
2
|
|
3
|
|
4
|
|
5
|
|
6
|
Select the Frequency range checkbox.
|
|
7
|
|
8
|
|
1
|
|
2
|
|
3
|
|
4
|
|
5
|
|
6
|
|
1
|
|
3
|
|
4
|
|
5
|
|
6
|
|
7
|
|
1
|
|
2
|
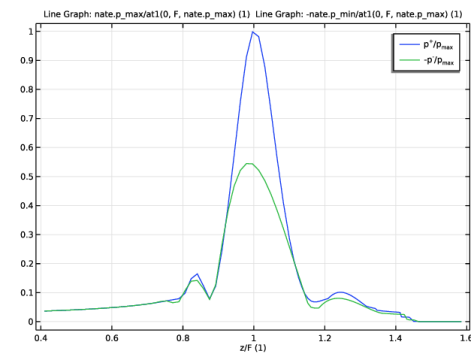
In the Settings window for 1D Plot Group, type Normalized Positive and Negative Pressure in the Label text field.
|
|
3
|
|
4
|
|
1
|
|
3
|
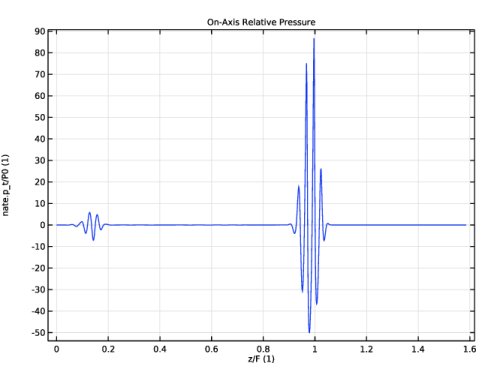
In the Settings window for Line Graph, click Replace Expression in the upper-right corner of the y-Axis Data section. From the menu, choose Component 1 (comp1) > Nonlinear Pressure Acoustics, Time Explicit > Pressure and sound pressure level > nate.p_max - Maximum acoustic pressure - Pa.
|
|
4
|
Locate the y-Axis Data section. In the Expression text field, type nate.p_max/at1(0, F, nate.p_max).
|
|
5
|
|
6
|
|
7
|
|
8
|
|
10
|
|
1
|
|
2
|
In the Settings window for Line Graph, click Replace Expression in the upper-right corner of the y-Axis Data section. From the menu, choose Component 1 (comp1) > Nonlinear Pressure Acoustics, Time Explicit > Pressure and sound pressure level > nate.p_min - Minimum acoustic pressure - Pa.
|
|
3
|
Locate the y-Axis Data section. In the Expression text field, type -nate.p_min/at1(0, F, nate.p_max).
|
|
4
|
Locate the Legends section. In the table, enter the following settings:
|
|
5
|
|
1
|
|
2
|
|
3
|
|
1
|
|
2
|
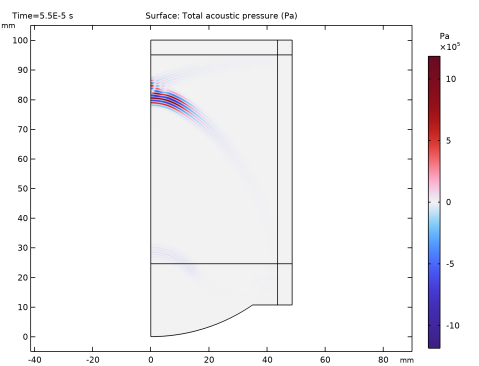
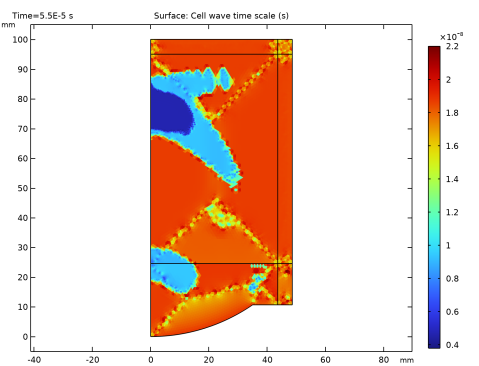
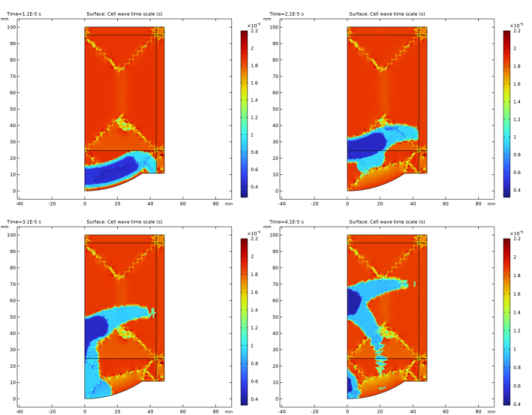
In the Settings window for Surface, click Replace Expression in the upper-right corner of the Expression section. From the menu, choose Component 1 (comp1) > Nonlinear Pressure Acoustics, Time Explicit > Cell time scale > nate.wtc - Cell wave time scale - s.
|
|
3
|
|
4
|
|
5
|