The ray tracing simulation consists of propagating rays (ray index n) in frequency bands (band index
c and center frequency
fc). In each frequency band
c, the ray power
Qn (of ray
n) decreases at ray wall interactions (absorption) and due to volumetric attenuation. Wall absorption, scattering, and volumetric attenuation characteristics is defined with a given n’th octave band resolution.
The ray arrives at the receiver at time tn with an intensity/pressure amplitude contribution, given by
where Vrec is the volume of the receiver,
d is the distance traveled in the receiver by the ray,
prms is the RMS pressure,
ρ is the density, and
c is the speed of sound. The arrival time
tn is computed as the time instance where the ray has traveled half the distance
d/2 in the receiver volume (this leads to a good accuracy in time).
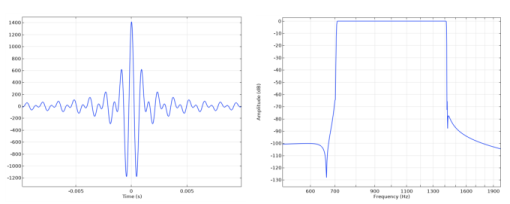
To reconstruct the IR the filter kernels (of the nth octave filter bank) are convolved with the impulse signal (it is assumed that rays carry an impulse or Dirac impulse when emitted from the source). The filter kernel of band
c is
wc(
t). The built-in filters are so-called brick-wall with Kaiser window filters, defined in octaves, 1/3 octaves, or 1/6 octaves (see
Impulse Response Plot). The
fc = 1 kHz octave filter kernel in time and frequency domain is depicted in
Figure 8-8.
where Nref,n is the number of reflections undergone by ray
n, before arriving at the receiver. The first factor in the sum ensures that rays that follow the same path (such as direct sound and early reflections) are summed up correctly (in phase), while rays that have undergone many reflections get a pseudo random phase applied (see
Ref. 6 and
Ref. 7).
where the superscript p stands for power summed signal. This ensures a consistent energy content and energy conservation of the reconstructed IR signal.
