You are viewing the documentation for an older COMSOL version. The latest version is
available here.
Select an Array 1D (

),
Array 2D (

), or
Array 3D (

) dataset, found under the
More Datasets,
More 2D Datasets, and
More 3D Datasets submenus, to create an array of data for plots based on another dataset. Right-click an
Array 1D,
Array 2D, or
Array 3D dataset node to add a
Selection subnode if desired. The
Array 1D,
Array 2D, and
Array 3D nodes’
Settings windows include the following sections:
From the Dataset list, choose the dataset that you want to duplicate into an array. The list includes all available datasets that are compatible with the Array dataset (1D datasets for Array 1D, 2D datasets for Array 2D, and 3D datasets for Array 3D).
In this section you define the part of space that the array is created from. From the Method list, select
Automatic (the default) to use the bounding box of the source dataset as input. Alternatively, select
Manual to specify the part of space manually:
|
•
|
Under Size, define the dimensions of the input space in the x, y (2D and 3D), and (3D only) z fields (the names of the space coordinates can vary).
|
|
•
|
Under Position, define the base point for the input space. From the Base list, select Corner (the default) or Center to use a location at the lower-left corner or the center as the base position. Then enter the base position in the x, y, and (3D only) z fields (the names of the space coordinates can vary).
|
Here you specify the size of the array as the number of cells in each direction. From the Array type, choose
Linear,
Rectangular (2D only), or
Three-dimensional (3D only). For
Linear, enter the number of cells as a positive integer in the
Size field. You specify the distance between each cell in the
Displacement section below. For
Rectangular and
Three-dimensional, you specify the number of cells as positive integers in each i direction in the
x size,
y size (2D and 3D), and
z size (3D only) fields. For 1D, enter the number of cells in the
x size field (the names of the space coordinates can vary).
In this section you specify the displacement used to separate each cell in the array. From the Method list, select
Automatic (the default) to a displacement that is the same as the size defined in the
Input section. This means that to create an array of cells that have the same size as the bounding box of the underlying dataset, you can use
Automatic both here and in the
Input section. Alternatively, select
Manual to specify the displacement manually by entering displacement distances in the
x,
y (2D and 3D), and
z (3D only) fields (the names of the space coordinates can vary). The displacement cannot be smaller than the size of the input cell.
|
•
|
Cartesian. When you choose this option, specify the rotation axis in the x, y, and z fields below.
|
|
•
|
Spherical. When you choose this option, specify the rotation axis in the θ and φ fields below.
|
In the Angle increment field, enter the angle (in radians) with which the rotation will be incremented for each array item that is added.
In 3D, under Point on axis of rotation, enter the coordinates for a point on the axis in the
x,
y, and
z fields (SI unit: m).
In 2D, under Center of rotation, enter the coordinates for a point on the axis in the
x and
y fields (SI unit: m).
|
•
|
Under Space variables, you create variables that evaluate to the coordinates in the dataset’s coordinate system. Enter variable names in the x, y (2D and 3D), and z (3D only) fields (the names of the space coordinates can vary).
|
|
•
|
Under Cell variables, you create integer variables that identify the current cell in the array. For example, the 3D cell with variable values (0, 0, 0) corresponds to the underlying dataset’s cell. Enter variable names in the x, y, and z (3D only) fields (the names of the space coordinates can vary).
|
Select the Floquet-Bloch periodicity check box if you want to incorporate phase changes from Floquet-Bloch periodicity. The Floquet-Bloch periodicity corresponds to the relation
where R is the lattice vector, and
k is the wave number. For Array datasets, the lattice vector when evaluating in a cell of the array is the displacement from the base cell. You define the Floquet-Bloch periodicity using the components of the wave vector
k (SI unit: 1/m) in the
x,
y (2D and 3D), and
z (3D only) fields under
Wave vector. The wave vector can be complex, and you can use this to model gains and losses over an array.
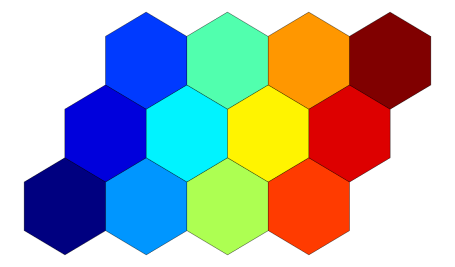
Clear the Check for overlap between cells check box to make it possible to, for example, create a hexagonal lattice by composing two linear arrays. It also makes it possible to create rectangular lattices where the unit cells are not rectangles. To create such lattices, you have to create an array of arrays, where you in the outer array specify the right shift.

