|
2
|
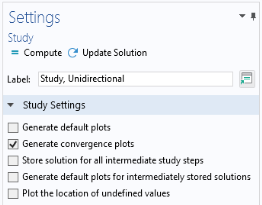
In the Settings window for Study, change the Label text field to Study, Unidirectional.
|
|
2
|
In the Settings window for Boundary Mode Analysis locate the Study Settings section, mark the check box for the Desired number of modes text field and enter 4 in the associated text field.
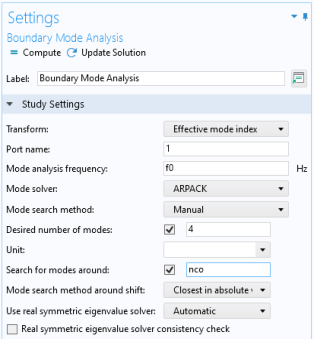 This finds the four lowest modes. This finds the four lowest modes. |
|
3
|
In the Search for modes around setting, mark the check box and enter nco in the associated text field, to search for the modes with effective index close to that of the waveguide cores.
|