It is possible to improve the quality of the Particle Trajectories plot by selecting the
Store extra time steps for wall interactions check box in the physics interface
Particle Release and Propagation section. When this check box is selected, the exact times of particle-wall interactions are stored in memory. When the solution is plotted, a number of extra time steps are included, which are typically close to the times at which particle-wall interactions occur.
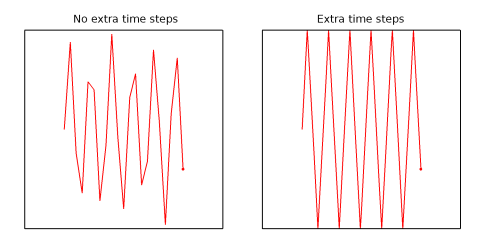
In the following example, a particle is released at point (0.2, 0.5) in a unit square with initial velocity
(0.6, 11.2). The walls of the square are given the
Bounce wall condition. The Time-Dependent study is run until
1 s, with output every
0.05 s.
The particle trajectory is computed with the Store extra time steps for wall interactions check box cleared and with the check box selected. The results are shown in
Figure 2-6.
Selecting the Store extra time steps for wall interactions check box does not guarantee that all particle-wall interaction times will be shown in the Particle Trajectories plot. Limitations on the number of extra time steps are imposed to avoid degrading performance by rendering an overwhelming number of particle positions.
For example, consider a model in which 10,000 particles are traced and each particle undergoes approximately
100 wall collisions. There could be as many as
1,000,000 distinct solution times at which a particle-wall collision occurs, each of which would require all
10,000 particles to be rendered because every particle must be shown at the same list of solution times.
To prevent this, the maximum number of extra time steps shown in the Particle Trajectories plot is restricted by options in the plot settings. It is constrained either by an absolute number of extra time steps or by a multiple of the number of time steps stored in the solution.
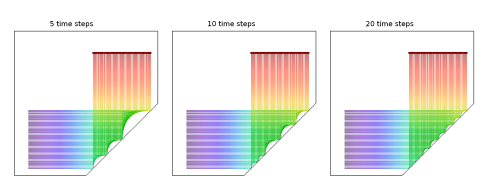
The following plot illustrates this behavior. In this example, 50 model particles are released with varying initial
y-coordinates and initial
x-coordinates of
0.2. The particles are specularly reflected by the inclined wall so that they bounce upward.
In the image on the left, a total of 5 time steps are stored in the solution, so no more than
5 additional particle-wall interaction times are plotted. In the middle image, a total of
10 time steps are stored in the solution. In the right image, a total of
20 time steps are stored in the solution. As the number of time steps increases, an increasing number of model particles are shown to touch the wall because increasing the number of solution times also increases the number of wall interaction times that can be rendered.
Typically the Store extra time steps for wall interactions check box will have a very pronounced effect on models with a small number of model particles, whereas for models with a very large number of particles it may be necessary to specify a very large maximum number of extra steps to generate higher-quality plots.