PDF

Fresnel Lens
Introduction
Fresnel lenses are a special type of optic devices that are extremely thin — as thin as the order of the wavelength of light — and are designed to have focusing, defocusing, and even aberration correction capabilities. A Fresnel lens is designed from an original lens by zoning and folding as depicted in Figure 1. First, the original lens is sectioned along its height in layers of thickness mλ/(n1), where m, λ, and n are the integer Fresnel lens order, the wavelength, and the refractive index, respectively. This corresponds to a 2mπ radian phase of the light in the lens material. Then the residual parts on the top are folded to the bottom. The concept of this design method is based on the assumption that the incident light is a plane wave with a flat phase front and the material parts of height mλ/(n1) that are removed do nothing to the phase of the light. Under this assumption, the Fresnel lens is expected to exhibit approximately the same behavior as the original unfolded lens. When a continuous Fresnel lens is designed, it is typically digitized to a digital Fresnel lens for manufacturing reasons.
Figure 1: Design of a Fresnel lens.
Model Definition
In this model, a plano-convex spherical lens of 50 μm diameter and 150 μm focal length for 0.5 μm wavelength is converted to a 16-level digitized Fresnel lens of the first order. A plane wave is incident on the bottom boundary, passes through the Fresnel lens, and exits at the exit boundary above the Fresnel lens. The transmitted wave is then propagated to the focal plane.
A comparison is made between the analytical solution using the Fresnel approximation and the solution obtained using both the Electromagnetic Waves, Frequency Domain and the Electromagnetic Waves, Beam Envelopes interfaces. For this model you get a large speed advantage using the Electromagnetic Waves, Beam Envelopes interface compared to the Electromagnetic Waves, Frequency Domain interface.
In addition to the comparison between the analytical solution and the solutions from the two physics interfaces, the model also demonstrates how to use a spatial fast Fourier transform (FFT) to analyze the scalar field in the focal plane. This postprocessing feature is straightforward to set up compared to manually define the integral for the Fourier transform and leads to the same result.
Finally, this model explains how to add and run a model method. In this case, the model method helps rebuild the geometry when the geometry parameters have been changed.
Results and Discussion
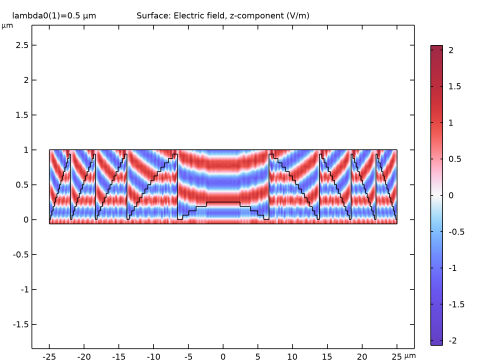
Figure 2 shows the electric field amplitude around the Fresnel lens and Figure 3 shows the corresponding electric field norm. In the amplitude plot, it is clearly seen that the wavelet exiting from each zone generates a curved wavefront in the air domain and that all wavefronts are in phase and are making one converging wave. In the norm plot, the nonuniformity of the field norm in the lens is a result of Fresnel reflection because the lens surface is not covered by any antireflective coating. You can also see some diffraction at the corner of each digitized step.
Figure 2: Electric field amplitude around the Fresnel lens. The plot is scaled as x:y = 1:10.
Figure 3: Electric field norm around the Fresnel lens. The plot is scaled as x:y = 1:10.
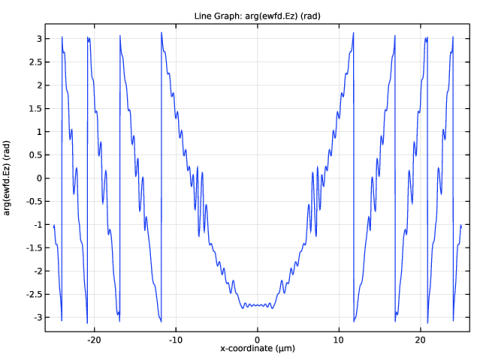
Figure 4 shows the phase function of the wave at the exit boundary, just above the Fresnel lens, at y = 1 μm. This quadratic phase function is approximately the same as in the case of the original unfolded lens.
Figure 4: Phase of the electric field at the exit boundary, y = 1 μm.
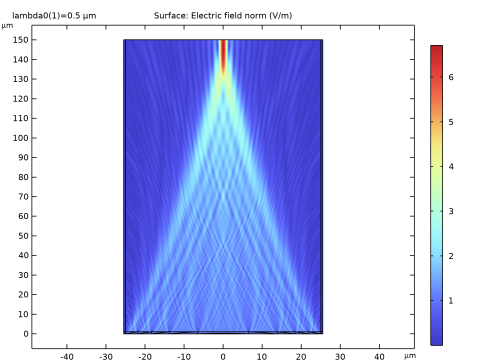
Figure 5 is a plot of the electric field norm in the entire air domain showing that the incident plane wave is focused at the focal plane.
Figure 5: Electric field norm in the air domain. Note that the plot is scaled as x:y = 2:1.
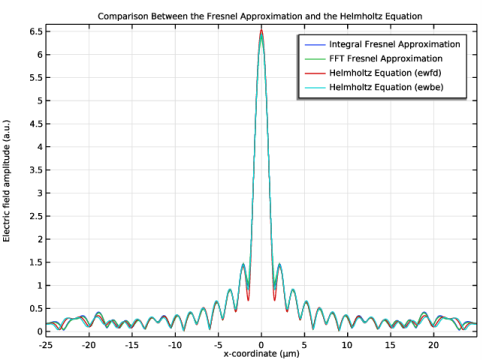
Finally, Figure 6 is the electric field amplitude at the focal plane. This is a typical image of digitized Fresnel lenses at the focus. There is the main peak at the center, as a result of the first order diffraction and there are some background caused by the zeroth order and the diffraction orders that were not considered in the design. The magnitude of this background varies depending on the digitization level and the straightness of the surface discontinuities. The result of the full-wave simulation based on the Helmholtz equation is overlaid with the result of the Fresnel approximation, which is computed by the Fresnel diffraction formula
(1)
applied to the electric field at the exit boundary at y = μm. Moreover an additional comparison is made with the result obtained using the built-in spatial fast Fourier transform feature. The results of the full-wave simulations and the Fresnel approximation are in very good agreement.
Figure 6: Comparison between the Fresnel approximation (Equation 1, blue curve), the Fresnel integral using the built-in spatial FFT functionality (green curve), and the full-wave simulation, using both the Electromagnetic Waves, Frequency Domain (red curve) and the Electromagnetic Waves, Beam Envelopes (cyan curve) interfaces.
Reference
1. Donald. C. O’Shea, Thomas J. Suleski, Alan D. Kathman, and Dennis W. Prather, Diffractive Optics: Design, Fabrication, and Test, SPIE Press, 2003.
Application Library path: Wave_Optics_Module/Verification_Examples/fresnel_lens
Modeling Instructions
From the File menu, choose New.
New
In the New window, click  Model Wizard.
Model Wizard
1
In the Model Wizard window, click  2D.
2
In the Select Physics tree, select Optics>Wave Optics>Electromagnetic Waves, Frequency Domain (ewfd).
3
Click Add.
4
In the Select Physics tree, select Optics>Wave Optics>Electromagnetic Waves, Beam Envelopes (ewbe).
5
Click Add.
6
Click  Study.
7
In the Select Study tree, select Preset Studies for Selected Physics Interfaces>Wavelength Domain.
8
Global Definitions
First add some parameters that will be used for defining the geometry, material, and the study.
Parameters 1
1
In the Model Builder window, under Global Definitions click Parameters 1.
2
In the Settings window for Parameters, locate the Parameters section.
3
Click  Load from File.
4
Fresnel Lens Zone
Add a geometry part that defines one zone of the Fresnel lens.
1
In the Model Builder window, right-click Global Definitions and choose Geometry Parts>2D Part.
2
In the Settings window for Part, type Fresnel Lens Zone in the Label text field.
Add the input parameter for this part.
3
Locate the Input Parameters section. In the table, enter the following settings:
4
Locate the Units section. From the Length unit list, choose µm, to make all lengths in plots appear in units of µm.
Now, add the internal parameters that will be used when defining the part.
Local Parameters
1
In the Geometry toolbar, click  Programming and choose Local Parameters.
2
In the Settings window for Local Parameters, locate the Local Parameters section.
3
Click  Load from File.
4
The parameter Mi defines the number of discretization levels for the zone. For all zones except the first one, this parameter will be equal to the global parameter M. However, for the first zone, the parameter Mi is normally smaller than M.
The remaining parameters define the x- and y-coordinates for the Fresnel lens zone.
Polygon 1 (pol1)
1
In the Geometry toolbar, click  Polygon.
2
In the Settings window for Polygon, locate the Coordinates section.
3
From the Data source list, choose Vectors.
4
In the x text field, type x0 x0 x1 x1 x2 x2 x3 x3 x4 x4 x5 x5 x6 x6 x7 x7 x8 x8 x9 x9 x10 x10 x11 x11 x12 x12 x13 x13 x14 x14 x15 x15 x16 x16.
5
In the y text field, type y0 y1 y1 y2 y2 y3 y3 y4 y4 y5 y5 y6 y6 y7 y7 y8 y8 y9 y9 y10 y10 y11 y11 y12 y12 y13 y13 y14 y14 y15 y15 y16 y16 y0.
6
Locate the Selections of Resulting Entities section. Find the Cumulative selection subsection. Click New.
7
In the New Cumulative Selection dialog box, type Fresnel Lens Zone in the Name text field.
8
9
In the Geometry toolbar, click  Build All.
Notice that the shape for the first Fresnel lens zone has two parts, where the rightmost part is located below the base line. This part will be removed later when building the Fresnel lens geometry.
Geometry 1
1
In the Model Builder window, under Component 1 (comp1) click Geometry 1.
2
In the Settings window for Geometry, locate the Units section.
3
From the Length unit list, choose µm, to make all lengths in plots appear in units of µm.
The geometry is created by adding instances of the Fresnel Lens Zone part that we just have created. For each zone, the zone index input parameter is changed, to generate the correct coordinates for the zone.
Fresnel Lens Zone 1 (pi1)
1
In the Geometry toolbar, click  Parts and choose Fresnel Lens Zone.
2
In the Settings window for Part Instance, click to expand the Domain Selections section.
3
Click New Cumulative Selection.
4
In the New Cumulative Selection dialog box, type Fresnel Lens in the Name text field.
5
6
In the Settings window for Part Instance, locate the Domain Selections section.
7
Fresnel Lens Zone 2 (pi2)
1
Right-click Fresnel Lens Zone 1 (pi1) and choose Duplicate.
2
In the Settings window for Part Instance, locate the Input Parameters section.
3
Fresnel Lens Zone 3 (pi3)
1
Right-click Fresnel Lens Zone 2 (pi2) and choose Duplicate.
2
In the Settings window for Part Instance, locate the Input Parameters section.
3
Fresnel Lens Zone 4 (pi4)
1
Right-click Fresnel Lens Zone 3 (pi3) and choose Duplicate.
2
In the Settings window for Part Instance, locate the Input Parameters section.
3
Fresnel Lens Zone 5 (pi5)
1
Right-click Fresnel Lens Zone 4 (pi4) and choose Duplicate.
2
In the Settings window for Part Instance, locate the Input Parameters section.
3
Union 1 (uni1)
Before proceeding further, make the created half Fresnel lens a single domain, using a Union operation.
1
In the Geometry toolbar, click  Booleans and Partitions and choose Union.
2
Click in the Graphics window and then press Ctrl+A to select all objects.
3
In the Settings window for Union, locate the Union section.
4
Clear the Keep interior boundaries check box.
5
Click  Build Selected.
Mirror 1 (mir1)
1
In the Geometry toolbar, click  Transforms and choose Mirror.
2
3
In the Settings window for Mirror, locate the Input section.
4
Select the Keep input objects check box.
5
Click  Build Selected.
6
Click the  Zoom Extents button in the Graphics toolbar.
Union 2 (uni2)
Make a single domain out of the two lens halves.
1
In the Geometry toolbar, click  Booleans and Partitions and choose Union.
2
Click in the Graphics window and then press Ctrl+A to select both objects.
3
In the Settings window for Union, locate the Union section.
4
Clear the Keep interior boundaries check box.
5
Click  Build Selected.
Rectangle 1 (r1)
The first zone has a domain that is below the base of the Fresnel lens. That part is removed by making an intersection with a rectangle having the size of the expected bounding box for the Fresnel lens.
1
In the Geometry toolbar, click  Rectangle.
2
In the Settings window for Rectangle, locate the Size and Shape section.
3
In the Width text field, type D.
4
In the Height text field, type d+dm.
5
Locate the Position section. In the x text field, type -D/2.
6
In the y text field, type -dm.
Intersection 1 (int1)
1
In the Geometry toolbar, click  Booleans and Partitions and choose Intersection.
2
Click in the Graphics window and then press Ctrl+A to select both objects.
3
In the Settings window for Intersection, click  Build All Objects.
Rectangle 2 (r2)
Now define the propagation domain from the lens to the focal plane.
1
In the Geometry toolbar, click  Rectangle.
2
In the Settings window for Rectangle, locate the Size and Shape section.
3
In the Width text field, type D.
4
In the Height text field, type f+dm.
5
Locate the Position section. In the x text field, type -D/2.
6
In the y text field, type -dm.
7
Click to expand the Layers section. In the table, enter the following settings:
Rectangle 3 (r3)
Now, add two rectangular domains that will be used for perfectly matched layers (PMLs).
1
Right-click Rectangle 2 (r2) and choose Duplicate.
2
In the Settings window for Rectangle, locate the Size and Shape section.
3
In the Width text field, type lda0.
4
Locate the Position section. In the x text field, type -D/2-lda0.
Rectangle 4 (r4)
1
Right-click Rectangle 3 (r3) and choose Duplicate.
2
In the Settings window for Rectangle, locate the Position section.
3
In the x text field, type D/2.
4
Click  Build All Objects.
5
Click the  Zoom Extents button in the Graphics toolbar.
Definitions
Add the perfectly matched layer.
Perfectly Matched Layer 1 (pml1)
1
In the Definitions toolbar, click  Perfectly Matched Layer.
2
Materials
Now add the materials. In COMSOL the first material is applied to all domains, so we start by adding the air to all domains and then add the glass to the Fresnel lens.
Add Material
1
In the Home toolbar, click  Add Material to open the Add Material window.
2
Go to the Add Material window.
3
4
Click Add to Component in the window toolbar.
5
In the Home toolbar, click  Add Material to close the Add Material window.
Materials
Glass
1
In the Model Builder window, under Component 1 (comp1) right-click Materials and choose Blank Material.
2
In the Settings window for Material, type Glass in the Label text field.
3
Locate the Geometric Entity Selection section. From the Selection list, choose Fresnel Lens.
4
Click  Zoom to Selection.
5
Locate the Material Contents section. In the table, enter the following settings:
Definitions
Now define some selections that will be used later.
Exterior Boundaries
1
In the Definitions toolbar, click  Explicit.
2
In the Settings window for Explicit, type Exterior Boundaries in the Label text field.
3
Locate the Input Entities section. Select the All domains check box.
4
Locate the Output Entities section. From the Output entities list, choose Adjacent boundaries.
Input Plane
1
In the Definitions toolbar, click  Box.
2
In the Settings window for Box, type Input Plane in the Label text field.
3
Locate the Geometric Entity Level section. From the Level list, choose Boundary.
4
Locate the Input Entities section. From the Entities list, choose From selections.
5
Under Selections, click  Add.
6
In the Add dialog box, select Exterior Boundaries in the Selections list.
7
8
In the Settings window for Box, locate the Box Limits section.
9
In the x minimum text field, type -D/2.
10
In the x maximum text field, type D/2.
11
In the y minimum text field, type -dm.
12
In the y maximum text field, type -dm/2.
13
Locate the Output Entities section. From the Include entity if list, choose Entity inside box.
Scattering Boundaries
1
In the Definitions toolbar, click  Difference.
2
In the Settings window for Difference, type Scattering Boundaries in the Label text field.
3
Locate the Geometric Entity Level section. From the Level list, choose Boundary.
4
Locate the Input Entities section. Under Selections to add, click  Add.
5
In the Add dialog box, select Exterior Boundaries in the Selections to add list.
6
7
In the Settings window for Difference, locate the Input Entities section.
8
Under Selections to subtract, click  Add.
9
In the Add dialog box, select Input Plane in the Selections to subtract list.
10
11
Click the  Zoom to Selection button in the Graphics toolbar.
Exit Plane
1
In the Definitions toolbar, click  Explicit.
2
In the Settings window for Explicit, type Exit Plane in the Label text field.
3
Locate the Input Entities section. From the Geometric entity level list, choose Boundary.
4
5
Click the  Zoom to Selection button in the Graphics toolbar.
Integration 1 (intop1)
Before setting up the physics, a nonlocal integration coupling will be defined for the Exit Plane selection. This operator will be used for calculating the analytic Fresnel diffraction integral.
1
In the Definitions toolbar, click  Nonlocal Couplings and choose Integration.
2
In the Settings window for Integration, locate the Source Selection section.
3
From the Geometric entity level list, choose Boundary.
4
From the Selection list, choose Exit Plane.
Electromagnetic Waves, Frequency Domain (ewfd)
1
In the Model Builder window, under Component 1 (comp1) click Electromagnetic Waves, Frequency Domain (ewfd).
2
In the Settings window for Electromagnetic Waves, Frequency Domain, locate the Components section.
3
From the Electric field components solved for list, choose Out-of-plane vector.
Scattering Boundary Condition 1
1
In the Physics toolbar, click  Boundaries and choose Scattering Boundary Condition.
2
In the Settings window for Scattering Boundary Condition, locate the Boundary Selection section.
3
From the Selection list, choose Input Plane.
4
Locate the Scattering Boundary Condition section. From the Incident field list, choose Wave given by E field.
5
Specify the E0 vector as
6
From the Order list, choose Second order, to reduce the reflections from radiation incident with a nonnormal direction to this boundary.
Scattering Boundary Condition 2
1
In the Physics toolbar, click  Boundaries and choose Scattering Boundary Condition.
2
In the Settings window for Scattering Boundary Condition, locate the Boundary Selection section.
3
From the Selection list, choose Scattering Boundaries.
4
Click the  Zoom Extents button in the Graphics toolbar.
5
Locate the Scattering Boundary Condition section. From the Order list, choose Second order, to reduce the reflections from radiation incident with a nonnormal direction to this surrounding boundary.
Fine Mesh
Add a name for the mesh, as we later will add a second mesh for the Electromagnetic Waves, Beam Envelopes interface.
1
In the Model Builder window, under Component 1 (comp1) click Mesh 1.
2
In the Settings window for Mesh, type Fine Mesh in the Label text field.
Free Triangular 1
In the Mesh toolbar, click  Free Triangular.
Size
1
In the Model Builder window, click Size.
2
In the Settings window for Size, locate the Element Size section.
3
Click the Custom button.
4
Locate the Element Size Parameters section. In the Maximum element size text field, type lda0/Nmesh.
Free Triangular 1
1
In the Model Builder window, click Free Triangular 1.
2
In the Settings window for Free Triangular, locate the Domain Selection section.
3
From the Geometric entity level list, choose Domain.
4
5
Click  Zoom to Selection.
Size 1
1
Right-click Free Triangular 1 and choose Size.
2
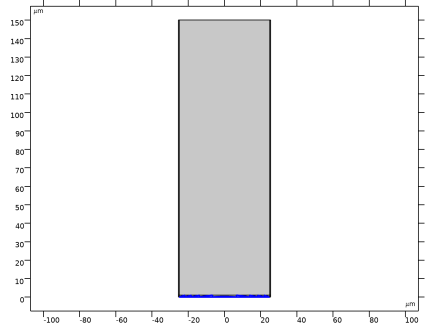
Select Domain 3 only. The simplest way to do this is to select entity 4 in the Selection box and then click the Remove from Selection (the minus sign) button in the Selection toolbar.
3
In the Settings window for Size, locate the Element Size section.
4
Click the Custom button.
5
Locate the Element Size Parameters section.
6
Select the Maximum element size check box. In the associated text field, type lda0/n/Nmesh.
Mapped 1
In the Mesh toolbar, click  Mapped.
Distribution 1
A Distribution node defines the number of mesh elements in the PMLs.
1
Right-click Mapped 1 and choose Distribution.
2
3
In the Settings window for Distribution, locate the Distribution section.
4
In the Number of elements text field, type 8.
Study 1
Step 1: Wavelength Domain
1
In the Model Builder window, under Study 1 click Step 1: Wavelength Domain.
2
In the Settings window for Wavelength Domain, locate the Study Settings section.
3
In the Wavelengths text field, type lda0.
4
Locate the Physics and Variables Selection section. In the table, clear the Solve for check box for Electromagnetic Waves, Beam Envelopes (ewbe).
5
In the Home toolbar, click  Compute.
Results
Electric Field Norm (ewfd)
1
In the Settings window for 2D Plot Group, type Electric Field Norm (ewfd) in the Label text field.
Change the view now to make the plot wider to improve the aspect ratio.
2
Locate the Plot Settings section. From the View list, choose View 1.
3
Click  Go to Source.
Definitions
Axis
1
In the Model Builder window, expand the View 1 node, then click Axis.
2
In the Settings window for Axis, locate the Axis section.
3
From the View scale list, choose Manual.
4
In the x scale text field, type 2.
5
Click  Update.
Results
Electric Field Norm (ewfd)
Click the  Zoom Extents button in the Graphics toolbar.
Electric Field Amplitude (ewfd)
1
In the Model Builder window, right-click Electric Field Norm (ewfd) and choose Duplicate.
2
In the Settings window for 2D Plot Group, type Electric Field Amplitude (ewfd) in the Label text field.
Surface 1
1
In the Model Builder window, expand the Electric Field Amplitude (ewfd) node, then click Surface 1.
2
In the Settings window for Surface, locate the Expression section.
3
In the Expression text field, type ewfd.Ez.
4
Locate the Coloring and Style section. Click  Change Color Table.
5
In the Color Table dialog box, select Wave>WaveLight in the tree.
6
7
In the Settings window for Surface, locate the Coloring and Style section.
8
From the Scale list, choose Linear symmetric.
9
In the Electric Field Amplitude (ewfd) toolbar, click  Plot.
Electric Field Norm Near Lens (ewfd)
1
In the Model Builder window, right-click Electric Field Norm (ewfd) and choose Duplicate.
2
In the Settings window for 2D Plot Group, type Electric Field Norm Near Lens (ewfd) in the Label text field.
Definitions
Add a new view that will be used to show the near field close to the lens.
View 3
In the Model Builder window, under Component 1 (comp1)>Definitions right-click View 1 and choose Duplicate.
Axis
1
In the Model Builder window, expand the View 3 node, then click Axis.
2
In the Settings window for Axis, locate the Axis section.
3
In the x scale text field, type 1.
4
In the y scale text field, type 10.
5
Click  Update.
Hide for Physics 1
1
In the Model Builder window, right-click View 3 and choose Hide for Physics.
2
Click the  Zoom Extents button in the Graphics toolbar.
3
Results
Electric Field Norm Near Lens (ewfd)
1
In the Model Builder window, under Results click Electric Field Norm Near Lens (ewfd).
2
In the Settings window for 2D Plot Group, locate the Plot Settings section.
3
From the View list, choose View 3.
4
In the Electric Field Norm Near Lens (ewfd) toolbar, click  Plot.
5
Click the  Zoom Extents button in the Graphics toolbar.
Electric Field Amplitude Near Lens (ewfd)
1
In the Model Builder window, right-click Electric Field Amplitude (ewfd) and choose Duplicate.
2
In the Settings window for 2D Plot Group, type Electric Field Amplitude Near Lens (ewfd) in the Label text field.
3
Locate the Plot Settings section. From the View list, choose View 3.
4
In the Electric Field Amplitude Near Lens (ewfd) toolbar, click  Plot.
5
Click the  Zoom Extents button in the Graphics toolbar.
Electric Field Amplitude at Exit Plane (ewfd)
Now create two line plots displaying the electric field amplitude and phase, respectively.
1
In the Home toolbar, click  Add Plot Group and choose 1D Plot Group.
2
In the Settings window for 1D Plot Group, type Electric Field Amplitude at Exit Plane (ewfd) in the Label text field.
Line Graph 1
1
Right-click Electric Field Amplitude at Exit Plane (ewfd) and choose Line Graph.
2
In the Settings window for Line Graph, locate the Selection section.
3
From the Selection list, choose Exit Plane.
4
Locate the y-Axis Data section. In the Expression text field, type ewfd.Ez.
5
Locate the x-Axis Data section. From the Parameter list, choose Expression.
6
In the Expression text field, type x.
7
In the Electric Field Amplitude at Exit Plane (ewfd) toolbar, click  Plot.
Electric Field Phase at Exit Plane (ewfd)
1
In the Model Builder window, right-click Electric Field Amplitude at Exit Plane (ewfd) and choose Duplicate.
2
In the Settings window for 1D Plot Group, type Electric Field Phase at Exit Plane (ewfd) in the Label text field.
Line Graph 1
1
In the Model Builder window, expand the Electric Field Phase at Exit Plane (ewfd) node, then click Line Graph 1.
2
In the Settings window for Line Graph, locate the y-Axis Data section.
3
In the Expression text field, type arg(ewfd.Ez).
4
In the Electric Field Phase at Exit Plane (ewfd) toolbar, click  Plot.
Now, create a line plot that compares the fields calculated with different, yet equivalent strategies. First by evaluating the Fresnel diffraction integral, then by using the spatial fast Fourier transform postprocessing feature (denoted FFT) and finally by propagating the field from the Exit Plane (denoted Helmholtz Equation (ewfd) in the following discussion). For convenience, start by adding all datasets (Grid 1D, Cut Line 2D and Spatial FFT) that will be needed later to create the line plot.
Grid 1D 1
1
In the Results toolbar, click  More Datasets and choose Grid>Grid 1D. This dataset defines the destination points for which the Fresnel diffraction integral will be evaluated.
2
In the Settings window for Grid 1D, locate the Parameter Bounds section.
3
In the Name text field, type u.
4
In the Minimum text field, type -D/2.
5
In the Maximum text field, type D/2.
Cut Line 2D 1
1
In the Results toolbar, click  Cut Line 2D. This dataset will constitute the source dataset for the Spatial FFT dataset that will be needed to perform the fast Fourier transform.
2
In the Settings window for Cut Line 2D, locate the Line Data section.
3
In row Point 1, set X to -25.
4
In row Point 1, set Y to 1.
5
In row Point 2, set X to 25.
6
In row Point 2, set Y to 1.
Spatial FFT 1
1
In the Results toolbar, click  More Datasets and choose Spatial FFT.
2
In the Settings window for Spatial FFT, locate the Data section.
3
From the Dataset list, choose Cut Line 2D 1.
4
Locate the Transformation section. Find the Spatial resolution subsection. From the Resolution list, choose Manual.
5
Find the Sampling resolution subsection. In the Nx text field, type 256.
6
Find the Spatial layout subsection. From the Layout list, choose Use zero padding. This is to increase the sampling points or equivalently the resolution of the Fourier space.
7
In the x padding text field, type 512.
8
Find the Fourier space variables subsection. In the fx text field, type fx.
9
Clear the Mask DC check box, in order to include the zero-frequency component that is otherwise set to zero by default. In optics, the zero spatial frequency usually corresponds to the center point in the image plane, which we don’t want to ignore.
Fresnel Versus Helmholtz Comparison
Now you can create the line plot to compare the results.
1
In the Results toolbar, click  1D Plot Group.
2
In the Settings window for 1D Plot Group, type Fresnel Versus Helmholtz Comparison in the Label text field.
3
Locate the Data section. From the Dataset list, choose Grid 1D 1.
Integral Fresnel Approximation
1
Right-click Fresnel Versus Helmholtz Comparison and choose Line Graph.
2
In the Settings window for Line Graph, type Integral Fresnel Approximation in the Label text field.
3
Locate the y-Axis Data section. In the Expression text field, type 1/sqrt(lda0*f)*abs(intop1(ewfd.Ez*exp(-i*k0*x^2/(2*f))*exp(i*2*pi*dest(u)*x/(lda0*f)))).
4
Select the Description check box. In the associated text field, type Diffraction integral.
5
Locate the x-Axis Data section. From the Parameter list, choose Expression.
6
In the Expression text field, type u, to express u in µm.
7
Click to expand the Legends section. Select the Show legends check box.
8
From the Legends list, choose Manual.
9
FFT Fresnel Approximation
1
In the Model Builder window, right-click Fresnel Versus Helmholtz Comparison and choose Line Graph.
2
In the Settings window for Line Graph, type FFT Fresnel Approximation in the Label text field.
3
Locate the Data section. From the Dataset list, choose Spatial FFT 1.
4
Locate the y-Axis Data section. In the Expression text field, type 1/sqrt(lda0*f)*abs(fft(ewfd.Ez*exp(-i*k0*x^2/(2*f)) ))*D/Nx.
5
Locate the x-Axis Data section. From the Parameter list, choose Expression.
6
In the Expression text field, type fx*lda0/(1[um])*f/(1[um]). The x-axis data, the spatial frequency fx, needs to be scaled by a factor equal to the product of the wavelength and the focal length.
7
Locate the Legends section. Select the Show legends check box.
8
From the Legends list, choose Manual.
9
Helmholtz Equation (ewfd)
1
Right-click Fresnel Versus Helmholtz Comparison and choose Line Graph.
2
In the Settings window for Line Graph, type Helmholtz Equation (ewfd) in the Label text field.
3
Locate the Data section. From the Dataset list, choose Study 1/Solution 1 (sol1).
4
Locate the Selection section. Click to select the  Activate Selection toggle button.
5
In the Graphics window toolbar, clicknext to  Go to Default View, then choose Go to View 1.
6
Click the  Zoom Extents button in the Graphics toolbar.
7
8
Locate the x-Axis Data section. From the Parameter list, choose Expression.
9
In the Expression text field, type x.
10
Locate the Legends section. Select the Show legends check box.
11
From the Legends list, choose Manual.
12
Fresnel Versus Helmholtz Comparison
1
In the Model Builder window, click Fresnel Versus Helmholtz Comparison.
2
In the Settings window for 1D Plot Group, locate the Plot Settings section.
3
Select the x-axis label check box. In the associated text field, type x-coordinate (µm).
4
Select the y-axis label check box. In the associated text field, type Electric field amplitude (a.u.).
5
Click to expand the Title section. From the Title type list, choose Manual.
6
In the Title text area, type Comparison Between the Fresnel Approximation and the Helmholtz Equation.
7
Locate the Axis section. Select the Manual axis limits check box.
8
In the x minimum text field, type -25.
9
In the x maximum text field, type 25.
10
In the Fresnel Versus Helmholtz Comparison toolbar, click  Plot.
Electromagnetic Waves, Beam Envelopes (ewbe)
Now redo the simulation for the Electromagnetic Waves, Beam Envelopes interface.
1
In the Model Builder window, under Component 1 (comp1) click Electromagnetic Waves, Beam Envelopes (ewbe).
2
In the Settings window for Electromagnetic Waves, Beam Envelopes, locate the Components section.
3
From the Electric field components solved for list, choose Out-of-plane vector.
4
Locate the Wave Vectors section. From the Number of directions list, choose Unidirectional.
5
Specify the k1 vector as
Scattering Boundary Condition 1
1
In the Physics toolbar, click  Boundaries and choose Scattering Boundary Condition.
2
In the Settings window for Scattering Boundary Condition, locate the Boundary Selection section.
3
From the Selection list, choose Input Plane.
4
Locate the Scattering Boundary Condition section. From the Incident field list, choose Wave given by E field.
5
Specify the E0 vector as
Scattering Boundary Condition 2
1
In the Physics toolbar, click  Boundaries and choose Scattering Boundary Condition.
2
In the Settings window for Scattering Boundary Condition, locate the Boundary Selection section.
3
From the Selection list, choose Scattering Boundaries.
Fine Mesh
Add a second, coarser, mesh that will be used for the simulation with the Electromagnetic Waves, Beam Envelopes interface.
1
In the Model Builder window, under Component 1 (comp1) right-click Fine Mesh and choose Duplicate.
Coarse Mesh
In the Settings window for Mesh, type Coarse Mesh in the Label text field.
Size 1
1
In the Model Builder window, expand the Coarse Mesh node.
2
Right-click Mapped 1 and choose Size.
3
In the Settings window for Size, locate the Element Size section.
4
Click the Custom button.
5
Locate the Element Size Parameters section.
6
Select the Maximum element size check box. In the associated text field, type 2*lda0.
Add Study
1
In the Home toolbar, click  Add Study to open the Add Study window.
2
Go to the Add Study window.
3
Find the Studies subsection. In the Select Study tree, select Preset Studies for Selected Physics Interfaces>Wavelength Domain.
4
Find the Physics interfaces in study subsection. In the table, clear the Solve check box for Electromagnetic Waves, Frequency Domain (ewfd).
5
Click Add Study in the window toolbar.
6
In the Home toolbar, click  Add Study to close the Add Study window.
Study 2
Step 1: Wavelength Domain
1
In the Settings window for Wavelength Domain, locate the Study Settings section.
2
In the Wavelengths text field, type lda0.
3
In the Home toolbar, click  Compute.
Results
Electric Field (ewbe)
1
In the Settings window for 2D Plot Group, locate the Plot Settings section.
2
From the View list, choose View 1.
3
Click the  Zoom Extents button in the Graphics toolbar.
Helmholtz Equation (ewbe)
1
In the Model Builder window, right-click Helmholtz Equation (ewfd) and choose Duplicate.
2
In the Settings window for Line Graph, type Helmholtz Equation (ewbe) in the Label text field.
3
Locate the Data section. From the Dataset list, choose Study 2/Solution 2 (sol2).
4
Locate the y-Axis Data section. In the Expression text field, type ewbe.normE.
5
Locate the Legends section. In the table, enter the following settings:
6
In the Fresnel Versus Helmholtz Comparison toolbar, click  Plot.
The comparison is excellent also with the Electromagnetic Waves, Beam Envelopes interface. Moreover, the simulation time is much shorter, as the Electromagnetic Waves, Beam Envelopes interface can be performed with a much coarser mesh.
Creating and Running a Model Method
New Method
The last part of this instruction shows how to implement a Model Method. If you change the parameter M, the number of discretization levels, you need to change the number of points in the polygon in the Fresnel Lens Zone geometry part. However, once you have created the Model Method, you can call the Model Method from the GUI to automatically rebuild the geometry part and the geometry. You can only create and edit the Model Method using Windows, but you can run it from both Linux and Mac.
1
In the Developer toolbar, click  New Method.
2
In the New Method dialog box, type rebuildGeometry in the Name text field.
3
Application Builder
rebuildGeometry
1
In the Application Builder window, under Methods click rebuildGeometry.
2
Copy the following code into the rebuildGeometry window:
// This method clears the coordinates in the Fresnel Lens Zone geometry parts
// and then calculates new coordinates

GeomSequence gs = model.geom("part1");
ModelParam modelParam = gs.localParam();

// Remove all local parameters, except the Digitization count for zone parameter, Mi

for (String name : modelParam.varnames())
if (!"Mi".equals(name))
modelParam.remove(name);

// Read the digitization count parameter and generate local x-coordinate parameters
int digitizationLevelCount = (int) model.param().evaluate("M");
for (int i = 0; i < digitizationLevelCount+1; i++) {
String param = "x"+i;
if (i == 0)
modelParam.set(param, "if(zone > 1,sqrt(R^2-(R-(sag-(N+1-zone)*d))^2),0)", "Left end of zone");
else if (i == digitizationLevelCount)
modelParam.set(param, "sqrt(R^2-(R-(sag-(N-zone)*d))^2)", "Right end of zone");
else {
String paramOrder;
if (i == 1)
paramOrder = "1st";
else if (i == 2)
paramOrder = "2nd";
else if (i == 3)
paramOrder = "3rd";
else
paramOrder = ""+i+"th";
modelParam.set(param, "sqrt(R^2-(z0+(N-zone+1)*d-(M-Mi+"+i+")*dm)^2)", paramOrder+" step right end");
}
}

// Generate local y-coordinate parameters
for (int i = 0; i < digitizationLevelCount+1; i++) {
String param = "y"+i;
if (i == 0)
modelParam.set(param, "-dm", "Base level");
else {
String paramOrder;
if (i == 1)
paramOrder = "1st";
else if (i == 2)
paramOrder = "2nd";
else if (i == 3)
paramOrder = "3rd";
else
paramOrder = ""+i+"th";
modelParam.set(param, "(Mi-"+i+")*dm", paramOrder+" level");
}
}

// Set the new coordinate vectors for the polygon
String xCoordinates = "";
String yCoordinates = "";
for (int i = 0; i < digitizationLevelCount+1; i++) {
xCoordinates += "x"+i+" "+"x"+i+(i < digitizationLevelCount ? " " : "");
yCoordinates += "y"+i+" "+"y"+(i < digitizationLevelCount ? (i+1)+" " : "0");
}

GeomFeature polygon = gs.feature("pol1");
polygon.set("x", xCoordinates);
polygon.set("y", yCoordinates);

// Recreate the geometry
model.component("comp1").geom("geom1").run();
Now, go back to the Model Builder, change the digitization count parameter M, and then run the new model method.
Methods
In the Home toolbar, click  Model Builder.
Global Definitions
Parameters 1
1
In the Model Builder window, under Global Definitions click Parameters 1.
2
In the Settings window for Parameters, locate the Parameters section.
3
4
In the Home toolbar, click  Run Method and choose rebuildGeometry.
Definitions
Verify that the structure now is using eight steps per zone.
Hide for Physics 1
In the Model Builder window, under Component 1 (comp1)>Definitions>View 3 right-click Hide for Physics 1 and choose Enable.
Exit Plane
1
In the Model Builder window, under Component 1 (comp1)>Definitions>Selections click Exit Plane.
2
In the Settings window for Explicit, in the Graphics window toolbar, clicknext to  Go to Default View, then choose Go to View 3.
3
Click the  Zoom Extents button in the Graphics toolbar.