PDF

Pore-Scale Flow
Introduction
This example uses Creeping Flow (Stokes Flow) to solve the flow in the interstices of a porous medium. The example comes from pore-scale flow experiments conducted by Arturo Keller, Maria Auset, and Sanya Sirivithayapakorn of the University of California, Santa Barbara. To produce the example geometry they used electron microscope images. This type of nonconventional pore-scale modeling with COMSOL Multiphysics sheds new light on the movement of large particulates and colloids moving through variable-pore geometries in the subsurface. Several of these researchers have published results from their COMSOL Multiphysics modeling in the publication Water Resources Research (Ref. 1 and Ref. 2).
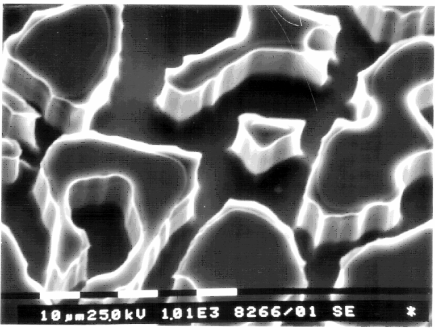
Keller, Auset, and Sirivithayapakorn designed their lab experiments on the basis of scanning electron microscope (SEM) images of thinly sliced rock sections (Figure 1). They etched the geometric patterns from the images onto a solid with an elaborate process similar to the etching of silicon wafers. They then transferred these images to DXF files, which they finally imported into COMSOL Multiphysics.
Figure 1: Scanning electron microscope image of the repeat pattern in the silicon wafer. The scale at bottom indicates that pore throat and body dimensions are on the order of 1 μm–100 μm (Ref. 1).
It is typical to represent fluid flow in the subsurface as a continuum process using average or “continuous” properties for the bulk rather than detailing the shape and orientation of each solid particle within a porous medium. Inserting the bulk properties into an equation, such as Darcy’s law or Brinkman equations, gives an average flow rate for the total volume. While bulk approximations typically produce excellent estimates sufficient for considering flow over large areas, they might miss the between-grain nuances that a close-up Stokes flow analysis would give.
This exercise is divided in two models: The first model takes one of the SEM images of Keller, Auset, and Sirivithayapakorn and solves for the flow velocity and pressure drop in the pore throats using the Creeping Flow interface. The geometry is imported as a binary file and only the pore space is meshed but not the solid regions. The second model is devoted to the modeling of the whole slice, by importing the SEM image and deriving porous medium properties, such as porosity and permeability for further use in the Brinkman Equations interface.
Model Definition
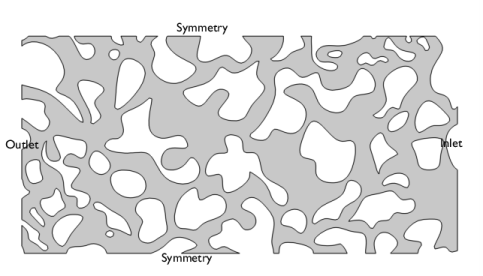
The entire model covers 640 μm by 320 μm. Water moves from right to left across the geometry. The flow in the pores does not penetrate the solid grains. The inlet and outlet fluid pressures are known. Assume no flow at the top and bottom boundaries.
Figure 2: A 640 μm by 320 μm geometry and boundary conditions.
Since the channels are at most 0.1 mm in width and the maximum velocity is lower than 104  m/s, the maximum Reynolds number is less than 0.01. Since the Reynolds number is far less than one, the example uses the Creeping Flow interface to solve Stokes equations, instead of solving the Navier–Stokes equations with the Laminar Flow interface. The fluid is considered isothermal and with constant density. Owing to the problem’s small scale, the example does not consider gravity.
The Creeping Flow interface solves Stokes equations in the channels. The incompressible assumption together with the stationary condition reads
here, p is the pressure (SI unit: Pa), u is the velocity field (SI unit: m/s), μ is the dynamic viscosity of the fluid (SI unit: Pa·s), and ρ is the density of the fluid (SI unit: kg/m3).
At the physical boundaries, the inlet pressure and the outlet pressure are known. Velocities are zero at the grain boundaries, which implies a no-slip condition. The flow is symmetric about the top and bottom boundaries. Table 1 summarizes the boundary conditions.
p = p0
p = 0
Here p0 is a specified pressure drop. Table 2 collects the relevant model data.
Table 2: Model Data.
ρ0
μ0
p0
Results and Discussion
Figure 3 shows the COMSOL Multiphysics solution predicted with the creeping flow analysis for the fluid velocity field in the pore spaces of a microscale porous slice. The velocity magnitude is higher in the narrowest pores than at the inlet, tending to decrease in stretches where the channels’ cross-sectional area increases.
Figure 3: Surface and arrow plots of the velocity field calculated by the Creeping Flow interface.
Model Definition
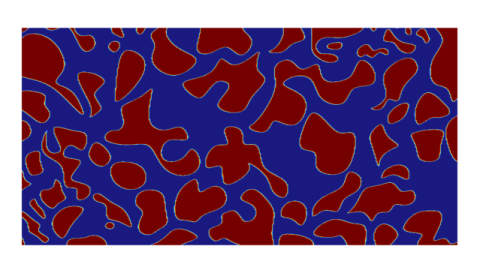
The second model takes a completely different approach than the first model. Here, the scanning electron microscope image is imported and physical properties are derived from the color scale. As opposed to consumer cameras, SEM images are grayscale, but in this example, the color code is binary; see Figure 4.
Instead of solving for the creeping flow in the channels, the incompressible, stationary Brinkman equations with the Stokes–Brinkman assumption are used:
Here, p is the pressure, u is Darcy’s velocity field, μ is the dynamic viscosity of the fluid, εp is the porosity, and κ is the permeability of the medium.
In order to define physical properties from the image color code, the following relations have been implemented for the porosity and permeability:
(1)
(2)
Here, im1 is an image function derived from the SEM image, which in this example ranges from 0 to 1 as a function of position. Other expressions can be implemented when importing RGB or grayscale images.
Figure 4: SEM image. The color code is blue for 0 and red for 1. COMSOL Multiphysics can handle grayscale and RGB images.
After solving the Brinkman equations with material parameters derived from the SEM image, it is possible to observe a very similar pressure and velocity profiles in the porous slice as obtained with the creeping flow model. Compare Figure 5 with the results in Figure 3.
Figure 5: Surface and arrow plots of the velocity field calculated by the Brinkman Equations interface. The porosity and permeability are taken from the SEM image, as written in Equation 1 and Equation 2.
Notes About the COMSOL Implementation
In this model, an external image is used to infer material properties, such as porosity and permeability. The same technique can be used to derive other material properties, like density and thermal or electric conductivity.
To find out more about how to import images, see the chapter about the Definitions node in the COMSOL Multiphysics Reference Manual.
References
1. M. Auset and A.A. Keller, “Pore-scale Processes that Control Dispersion of Colloids in Saturated Porous Media,” Water Resour. Res., vol. 40, no. 3, p. W03503, 2004.
2. S. Sirivithayapakorn and A.A. Keller, “Transport of Colloids in Saturated Porous Media: A Pore-scale Observation of the Size Exclusion Effect and Colloid Acceleration,” Water Resour. Res., vol. 39, no. 4, 2003.
Application Library path: Subsurface_Flow_Module/Fluid_Flow/pore_scale_flow
Modeling Instructions
From the File menu, choose New.
New
In the New window, click  Model Wizard.
Model Wizard
1
In the Model Wizard window, click  2D.
2
In the Select Physics tree, select Fluid Flow>Single-Phase Flow>Creeping Flow (spf).
3
Click Add.
4
Click  Study.
5
In the Select Study tree, select General Studies>Stationary.
6
Geometry 1
1
In the Model Builder window, under Component 1 (comp1) click Geometry 1.
2
In the Settings window for Geometry, locate the Units section.
3
From the Length unit list, choose µm.
Import 1 (imp1)
1
In the Home toolbar, click  Import.
2
In the Settings window for Import, locate the Import section.
3
Click  Browse.
4
5
Click  Import.
Global Definitions
Parameters 1
1
In the Model Builder window, under Global Definitions click Parameters 1.
2
In the Settings window for Parameters, locate the Parameters section.
3
Materials
Material 1 (mat1)
1
In the Model Builder window, under Component 1 (comp1) right-click Materials and choose Blank Material.
2
In the Settings window for Material, locate the Material Contents section.
3
Creeping Flow (spf)
Inlet 1
1
In the Model Builder window, under Component 1 (comp1) right-click Creeping Flow (spf) and choose Inlet.
2
3
In the Settings window for Inlet, locate the Boundary Condition section.
4
5
Locate the Pressure Conditions section. In the p0 text field, type p0.
Outlet 1
1
In the Physics toolbar, click  Boundaries and choose Outlet.
2
Symmetry 1
1
In the Physics toolbar, click  Boundaries and choose Symmetry.
2
Use the Select Box control in the Graphics toolbar to select all straight upper boundaries at once. Repeat to select all lower boundaries at once. Alternatively use the Paste Selection button next to the Selection list and enter the numbers listed above.
Mesh 1
In the Model Builder window, under Component 1 (comp1) right-click Mesh 1 and choose Build All.
Study 1
In the Home toolbar, click  Compute.
Results
Velocity (spf)
The first default plot shows the magnitude of the velocity field. Add a streamline plot to visualize the velocity field with the following steps.
Streamline 1
1
In the Velocity (spf) toolbar, click  Streamline.
2
3
In the Settings window for Streamline, locate the Coloring and Style section.
4
Find the Point style subsection. From the Type list, choose Arrow.
5
From the Color list, choose White.
6
In the Velocity (spf) toolbar, click  Plot.
Root
Next, set up the second model using the Brinkman equations.
Add Component
In the Model Builder window, right-click the root node and choose Add Component>2D.
Add Physics
1
In the Home toolbar, click  Add Physics to open the Add Physics window.
2
Go to the Add Physics window.
3
In the tree, select Fluid Flow>Porous Media and Subsurface Flow>Brinkman Equations (br).
4
Find the Physics interfaces in study subsection. In the table, clear the Solve check box for Study 1.
5
Click Add to Component 2 in the window toolbar.
6
In the Home toolbar, click  Add Physics to close the Add Physics window.
Add Study
1
In the Home toolbar, click  Add Study to open the Add Study window.
2
Go to the Add Study window.
3
Find the Physics interfaces in study subsection. In the table, clear the Solve check box for Creeping Flow (spf).
4
Find the Studies subsection. In the Select Study tree, select General Studies>Stationary.
5
Click Add Study in the window toolbar.
6
In the Model Builder window, click the root node.
7
In the Home toolbar, click  Add Study to close the Add Study window.
Global Definitions
Parameters 1
1
In the Settings window for Parameters, locate the Parameters section.
2
Click  Load from File.
3
Geometry 2
1
In the Model Builder window, under Component 2 (comp2) click Geometry 2.
2
In the Settings window for Geometry, locate the Units section.
3
From the Length unit list, choose µm.
Rectangle 1 (r1)
1
In the Geometry toolbar, click  Rectangle.
2
In the Settings window for Rectangle, locate the Size and Shape section.
3
In the Width text field, type L.
4
In the Height text field, type H.
5
Click  Build Selected.
Global Definitions
Define a function that will be used when setting up the material properties.
Image 1 (im1)
1
In the Home toolbar, click  Functions and choose Global>Image.
2
In the Settings window for Image, locate the Coordinates section.
3
In the x maximum text field, type L.
4
In the y maximum text field, type H.
5
Locate the File section. Click  Browse.
6
7
Click  Import.
8
Click  Create Plot.
Results
SEM image
In the Settings window for 2D Plot Group, type SEM image in the Label text field.
View 2D 3
In the Model Builder window, expand the Results>Views node.
Axis
1
In the Model Builder window, expand the View 2D 3 node, then click Axis.
2
In the Settings window for Axis, locate the Axis section.
3
From the View scale list, choose None.
4
Click  Update, and compare with Figure 4.
Materials
The functions for porosity and permeability are defined according to Equation 1 and Equation 2.
Material 2 (mat2)
1
In the Model Builder window, under Component 2 (comp2) right-click Materials and choose Blank Material.
2
In the Settings window for Material, locate the Material Contents section.
3
Brinkman Equations (br)
In the Model Builder window, under Component 2 (comp2) click Brinkman Equations (br).
Symmetry 1
1
In the Physics toolbar, click  Boundaries and choose Symmetry.
2
Inlet 1
1
In the Physics toolbar, click  Boundaries and choose Inlet.
2
In the Settings window for Inlet, locate the Boundary Condition section.
3
4
5
Locate the Pressure Conditions section. In the p0 text field, type p0.
Outlet 1
1
In the Physics toolbar, click  Boundaries and choose Outlet.
2
Mesh 2
1
In the Model Builder window, under Component 2 (comp2) click Mesh 2.
2
In the Settings window for Mesh, locate the Physics-Controlled Mesh section.
3
From the Element size list, choose Extra fine.
4
Click  Build All.
Compute the problem using adaptive mesh refinement.
Study 2
Step 1: Stationary
1
In the Model Builder window, under Study 2 click Step 1: Stationary.
2
In the Settings window for Stationary, click to expand the Adaptation and Error Estimates section.
3
From the Adaptation and error estimates list, choose Adaptation and error estimates.
4
From the Adaptation in geometry list, choose Geometry 2.
5
In the Home toolbar, click  Compute.
Results
Surface
Reproduce Figure 5 as follows.
Filter 1
1
In the Model Builder window, expand the Velocity (br) node.
2
Right-click Surface and choose Filter.
3
In the Velocity (br) toolbar, click  Plot.
4
In the Model Builder window, click Filter 1.
5
In the Settings window for Filter, locate the Element Selection section.
6
In the Logical expression for inclusion text field, type im1(x,y)<=0.5.
7
Select the Use derivatives check box.
8
In the Velocity (br) toolbar, click  Plot.
Streamline 1
1
In the Model Builder window, right-click Velocity (br) and choose Streamline.
2
3
In the Settings window for Streamline, locate the Coloring and Style section.
4
Find the Point style subsection. From the Type list, choose Arrow.
5
From the Color list, choose White.
6
In the Velocity (br) toolbar, click  Plot.