PDF

Nonlinear Harmonic Response
Introduction
This tutorial shows how to evaluate the harmonic response of a structure with a moderately nonlinear behavior. To solve such a nonlinear problem accurately, it is necessary to use a time-domain analysis. Solving in time domain can, however, be time consuming as it requires several periods until a steady-state solution is reached. A way to speed up such an analysis is to use a linearized frequency response analysis to provide good initial conditions. This approach is described in this tutorial example.
Model Definition
The model consists of a circular membrane, supported along its outer edge.
GEOMETRY
Membrane radius, 0.25 m
Material
Young’s modulus, E = 200 GPa
Mass density, ρ = 7850 kg/m3
Constraints
The outer edge of the membrane is supported in the transverse direction. Two points have constraints in the in-plane direction in order to avoid rigid body motions.
Load
The membrane is pretensioned by in the radial direction with σi = 100 MPa, giving a membrane force T0 20 kN/m.
A harmonically varying pressure with a 50 Hz frequency and a magnitude of F0 = 10 kPa is applied on the membrrane.
Results and Discussion
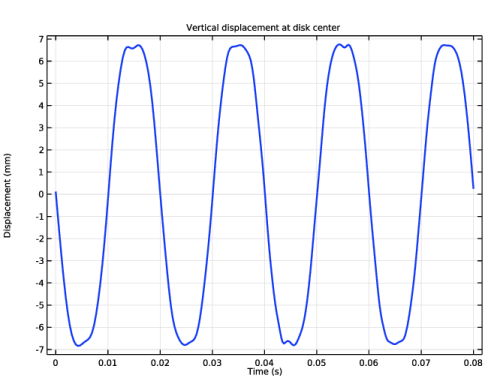
Figure 1 shows the vertical displacement at the disk center. The peak displacement is about 6.8 mm, which is significantly less than for the linearized solution (about 8.6 mm). The steady state is reached within a few periods, thanks to the initial condition using the linearized frequency-domain solution. This way, the analysis time is significantly reduced.
Figure 1: Vertical displacement of the disk center versus time near steady state.
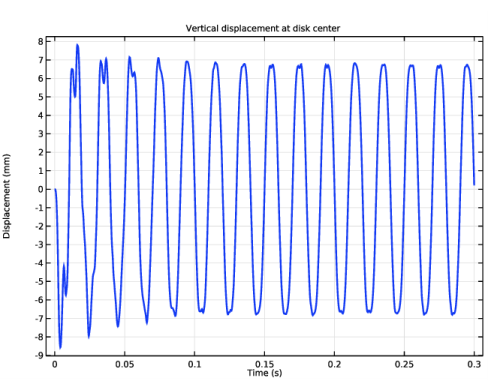
For comparison, Figure 2 shows the same vertical displacement at the disk center, but this time computed using the default initial condition. While the same peak displacement value is obtained, it requires more than 10 periods to reach the steady state.
Figure 2: Vertical displacement of the disk center versus time (computed from zero displacement/velocity).
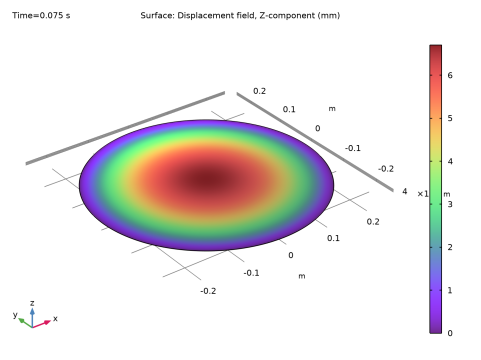
In Figure 3 the displacement at t = 0.075 s, corresponding to the peak deformation of the membrane, is shown.
Figure 3: Vertical displacement from time domain solution.
For comparison, Figure 4 shows the displacement from the frequency domain solution.
Figure 4: Vertical displacement from frequency domain solution.
Notes About the COMSOL Implementation
To save computational time to reach a steady-state solution using a periodic time-domain analysis, the initial conditions must be carefully selected. For a structural dynamics problem you need to set both the displacement and velocity fields at the initial time. The solution from a linearized harmonic response is a good choice and easy to obtain.
In COMSOL Multiphysics, you can use the withsol() operator to evaluate expression from a different solution. The first argument of the operator has to be the tag of the solution to use and the second argument the expression to evaluate.
Table 1 shows the expressions used as the initial condition for the displacement field.
Similarly, Table 2 shows the initial structural velocity field.
Application Library path: Structural_Mechanics_Module/Tutorials/nonlinear_harmonic
Modeling Instructions
From the File menu, choose New.
New
In the New window, click  Model Wizard.
Model Wizard
1
In the Model Wizard window, click  3D.
2
In the Select Physics tree, select Structural Mechanics>Membrane (mbrn).
3
Click Add.
4
Click  Study.
5
In the Select Study tree, select Preset Studies for Selected Physics Interfaces>Frequency Domain, Prestressed.
6
Global Definitions
Parameters 1
1
In the Model Builder window, under Global Definitions click Parameters 1.
2
In the Settings window for Parameters, locate the Parameters section.
3
Definitions
Cylindrical System 2 (sys2)
1
In the Model Builder window, expand the Component 1 (comp1)>Definitions node.
2
Right-click Definitions and choose Coordinate Systems>Cylindrical System.
Geometry 1
Work Plane 1 (wp1)
1
In the Geometry toolbar, click  Work Plane.
2
In the Model Builder window, click Work Plane 1 (wp1).
3
In the Settings window for Work Plane, click  Show Work Plane.
Work Plane 1 (wp1)>Circle 1 (c1)
1
In the Work Plane toolbar, click  Circle.
2
In the Settings window for Circle, locate the Size and Shape section.
3
In the Radius text field, type R.
Work Plane 1 (wp1)>Point 1 (pt1)
1
In the Work Plane toolbar, click  Point.
2
In the Model Builder window, right-click Geometry 1 and choose Build All.
3
Click the  Zoom Extents button in the Graphics toolbar.
Add Material
1
In the Home toolbar, click  Add Material to open the Add Material window.
2
Go to the Add Material window.
3
In the tree, select Built-in>Structural steel.
4
Right-click and choose Add to Component 1 (comp1).
5
In the Home toolbar, click  Add Material to close the Add Material window.
Membrane (mbrn)
Damping 1
1
In the Model Builder window, right-click Linear Elastic Material 1 and choose Damping.
2
In the Settings window for Damping, locate the Damping Settings section.
3
From the Input parameters list, choose Damping ratios.
4
In the f1 text field, type 170.
5
In the ζ1 text field, type 2e-2.
6
In the f2 text field, type 400.
7
In the ζ2 text field, type 4e-2.
Thickness and Offset 1
1
In the Model Builder window, under Component 1 (comp1)>Membrane (mbrn) click Thickness and Offset 1.
2
In the Settings window for Thickness and Offset, locate the Thickness and Offset section.
3
In the d0 text field, type th.
Prescribed Displacement 1
1
In the Physics toolbar, click  Edges and choose Prescribed Displacement.
2
In the Settings window for Prescribed Displacement, locate the Edge Selection section.
3
From the Selection list, choose All edges.
4
Locate the Prescribed Displacement section. Select the Prescribed in z direction check box.
Prescribed Displacement 2
1
In the Physics toolbar, click  Points and choose Prescribed Displacement.
2
3
In the Settings window for Prescribed Displacement, locate the Prescribed Displacement section.
4
Select the Prescribed in x direction check box.
5
Select the Prescribed in y direction check box.
Prescribed Displacement 3
1
In the Physics toolbar, click  Points and choose Prescribed Displacement.
2
3
In the Settings window for Prescribed Displacement, locate the Coordinate System Selection section.
4
From the Coordinate system list, choose Cylindrical System 2 (sys2).
5
Locate the Prescribed Displacement section. Select the Prescribed in phi direction check box.
Edge Load 1
1
In the Physics toolbar, click  Edges and choose Edge Load.
2
In the Settings window for Edge Load, locate the Edge Selection section.
3
From the Selection list, choose All edges.
4
Locate the Coordinate System Selection section. From the Coordinate system list, choose Cylindrical System 2 (sys2).
5
Locate the Force section. Specify the FL vector as
Add a spring with an arbitrary, small stiffness in order to suppress the out-of-plane singularity of the unstressed membrane.
Spring Foundation 1
1
In the Physics toolbar, click  Boundaries and choose Spring Foundation.
2
3
In the Settings window for Spring Foundation, locate the Spring section.
4
5
In the kA table, enter the following settings:
Face Load 1
1
In the Physics toolbar, click  Boundaries and choose Face Load.
2
3
In the Settings window for Face Load, locate the Force section.
4
From the Load type list, choose Pressure.
5
In the p text field, type F0.
6
Right-click Face Load 1 and choose Harmonic Perturbation.
In a frequency domain analysis, the zero phase corresponds to cos(time). Change the excitation load phase so that it it represents sin(time) since such a load will be used in the time-domain analysis.
Phase 1
1
In the Physics toolbar, click  Attributes and choose Phase.
2
In the Settings window for Phase, locate the Phase section.
3
In the φ text field, type -pi/2.
Study 1
Step 2: Frequency Domain Perturbation
1
In the Model Builder window, under Study 1 click Step 2: Frequency Domain Perturbation.
2
In the Settings window for Frequency Domain Perturbation, locate the Study Settings section.
3
In the Frequencies text field, type freq0.
4
Locate the Physics and Variables Selection section. Select the Modify model configuration for study step check box.
5
In the tree, select Component 1 (comp1)>Membrane (mbrn), Controls spatial frame>Spring Foundation 1.
6
7
In the Model Builder window, click Study 1.
8
In the Settings window for Study, locate the Study Settings section.
9
Clear the Generate default plots check box.
10
In the Home toolbar, click  Compute.
11
Click  Add Predefined Plot.
Add Predefined Plot
1
Go to the Add Predefined Plot window.
2
In the tree, select Study 1/Solution 1 (sol1)>Membrane>Displacement (mbrn).
3
Click Add Plot in the window toolbar.
4
In the Home toolbar, click  Add Predefined Plot.
Results
Displacement - Frequency Domain
1
In the Model Builder window, under Results click Displacement (mbrn).
2
In the Settings window for 3D Plot Group, type Displacement - Frequency Domain in the Label text field.
Study 1/Solution 1 (sol1)
1
In the Model Builder window, expand the Results>Datasets node, then click Study 1/Solution 1 (sol1).
2
In the Settings window for Solution, locate the Solution section.
3
In the Solution at angle (phase) text field, type -90.
Surface 1
1
In the Model Builder window, expand the Displacement - Frequency Domain node, then click Surface 1.
2
In the Settings window for Surface, locate the Expression section.
3
In the Expression text field, type w.
4
From the Unit list, choose mm.
5
In the Displacement - Frequency Domain toolbar, click  Plot.
Point Evaluation 1
1
In the Results toolbar, click  Point Evaluation.
2
3
In the Settings window for Point Evaluation, locate the Expressions section.
4
5
From the Expression evaluated for list, choose Peak value for total solution.
6
Click  Evaluate.
Membrane (mbrn)
The next step is to set initial conditions using the solution computed by the frequency response analysis.
Initial Values 2
1
In the Physics toolbar, click  Boundaries and choose Initial Values.
2
3
In the Settings window for Initial Values, locate the Initial Values section.
4
Specify the u vector as
5
Face Load 2
1
In the Physics toolbar, click  Boundaries and choose Face Load.
2
3
In the Settings window for Face Load, locate the Force section.
4
From the Load type list, choose Pressure.
5
In the p text field, type sin(2*pi*t*freq0)*F0.
Definitions
Point Probe 1 (point1)
1
In the Definitions toolbar, click  Probes and choose Point Probe.
2
In the Settings window for Point Probe, locate the Source Selection section.
3
Click  Clear Selection.
4
5
Locate the Expression section. In the Expression text field, type w.
6
From the Table and plot unit list, choose mm.
Add Study
1
In the Home toolbar, click  Add Study to open the Add Study window.
2
Go to the Add Study window.
3
Find the Studies subsection. In the Select Study tree, select General Studies>Time Dependent.
4
5
In the Home toolbar, click  Add Study to close the Add Study window.
Study 2
Step 1: Time Dependent
With good initial conditions you only need to compute for a few periods to reach steady state.
1
In the Settings window for Time Dependent, locate the Study Settings section.
2
In the Output times text field, type 0 range(3,1/20,4)/freq0.
3
Select the Include geometric nonlinearity check box.
4
Locate the Physics and Variables Selection section. Select the Modify model configuration for study step check box.
5
In the tree, select Component 1 (comp1)>Membrane (mbrn), Controls spatial frame>Spring Foundation 1.
6
7
In the tree, select Component 1 (comp1)>Membrane (mbrn), Controls spatial frame>Face Load 1.
8
9
In the Model Builder window, click Study 2.
10
In the Settings window for Study, locate the Study Settings section.
11
Clear the Generate default plots check box.
12
In the Home toolbar, click  Compute.
13
Click  Add Predefined Plot.
Add Predefined Plot
1
Go to the Add Predefined Plot window.
2
In the tree, select Study 2/Solution 3 (sol3)>Membrane>Displacement (mbrn).
3
Click Add Plot in the window toolbar.
4
In the Home toolbar, click  Add Predefined Plot.
Results
Displacement - Time Domain
1
In the Model Builder window, under Results click Displacement (mbrn).
2
In the Settings window for 3D Plot Group, type Displacement - Time Domain in the Label text field.
3
Locate the Data section. From the Time (s) list, choose 0.075.
Surface 1
1
In the Model Builder window, expand the Displacement - Time Domain node, then click Surface 1.
2
In the Settings window for Surface, locate the Expression section.
3
In the Expression text field, type w.
4
From the Unit list, choose mm.
5
In the Displacement - Time Domain toolbar, click  Plot.
Displacement
1
In the Model Builder window, under Results click Probe Plot Group 2.
2
In the Settings window for 1D Plot Group, type Displacement in the Label text field.
3
Click to expand the Title section. From the Title type list, choose Manual.
4
In the Title text area, type Vertical displacement at disk center.
5
Locate the Plot Settings section.
6
Select the y-axis label check box. In the associated text field, type Displacement (mm).
Probe Table Graph 1
1
In the Model Builder window, expand the Displacement node, then click Probe Table Graph 1.
2
In the Settings window for Table Graph, locate the Coloring and Style section.
3
From the Width list, choose 2.
4
Click to expand the Legends section. Clear the Show legends check box.
5
In the Displacement toolbar, click  Plot.
The modeling part is now finished. Follow the steps below if you want to run the model later with modified parameter values.
Study 1
Step 1: Stationary
1
In the Model Builder window, under Study 1 click Step 1: Stationary.
2
In the Settings window for Stationary, locate the Physics and Variables Selection section.
3
Select the Modify model configuration for study step check box.
4
In the tree, select Component 1 (comp1)>Membrane (mbrn)>Face Load 1, Component 1 (comp1)>Membrane (mbrn)>Initial Values 2, and Component 1 (comp1)>Membrane (mbrn)>Face Load 2.
5
Step 2: Frequency Domain Perturbation
1
In the Model Builder window, click Step 2: Frequency Domain Perturbation.
2
In the Settings window for Frequency Domain Perturbation, locate the Physics and Variables Selection section.
3
In the tree, select Component 1 (comp1)>Membrane (mbrn), Controls spatial frame>Initial Values 2.
4
5
In the tree, select Component 1 (comp1)>Membrane (mbrn), Controls spatial frame>Face Load 2.
6