PDF

Quarter-Wave Transformer
Introduction
Transmission lines are used when the frequency of the electromagnetic signals is so high that the wave nature of the signals must be taken into account. A consequence of the wave nature is that the signals are reflected if there are abrupt changes of the characteristic impedance along the transmission line. Similarly, the load impedance, ZL, at the end of the transmission line must match its characteristic impedance, Z0. Otherwise there are reflections from the transmission line’s end.
A quarter-wave transformer (see Figure 1) is a component that can be inserted between the transmission line and the load to match the load impedance to the transmission line’s characteristic impedance. To get this functionality, the transformer must be a quarter of a wavelength long and the relation between the impedances involved must be
(1)
If the length and the impedance requirements are fulfilled, the load impedance does not give rise to any reflections.
Typically, the characteristic impedance of transmission lines, Z0, is 50 Ω. Thus, Zin in Equation 1 should be set to
when solving for the characteristic impedance of the quarter-wave transformer, Z.
Figure 1: Schematic of a quarter-wave transformer. The input impedance is Zin, the impedance of the transformer transmission line is Z, and the load impedance is ZL.
This example exemplifies some of the characteristics of a quarter-wave transformer. In particular, the model simulation shows that the transformer only provides matching for one particular frequency, namely that for which the transformer is a quarter of a wavelength long.
Model Definition
The 1D geometry of the example consists of two line intervals. Each line interval represents a separate transmission line, with different electrical parameters (distributed capacitance and inductance) and lengths.
To excite and terminate the transmission lines, use lumped ports. This also makes it easy to obtain the reflection (S11) and transmission (S21) coefficients for the system.
Results and Discussion
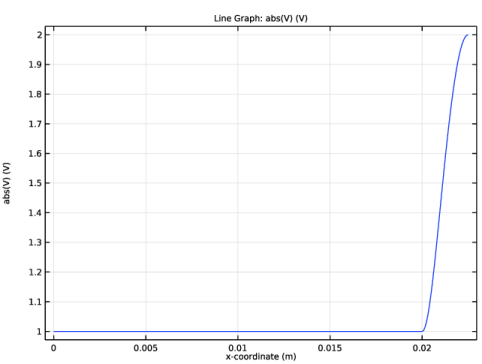
As an example of the output from the model, Figure 2 shows the voltage amplitude distribution along the transmission lines for a frequency where the quarter-wave transformer matches the load impedance to the characteristic impedance of the incoming transmission line. The figure shows that the amplitude is constant, indicating that there is no reflection and therefore no standing waves. Figure 3 shows the frequency spectrum for the same transformer. As is evident from the graph, the quarter-wave transformer only operates without reflection in a certain wavelength range.
Figure 2: Absolute value of the voltage versus the x-coordinate. The quarter-wave transformer starts at x-coordinate 0.02 m.
Figure 3: Spectral response for the transmission line. Notice that the transmission coefficient (S21) peaks at the frequency (1 GHz) for which the transformer is a quarter-wave long. At that frequency the reflection coefficient (S11) is zero (approaches negative infinity which the dB scale used in the graph).
Application Library path: RF_Module/Transmission_Lines_and_Waveguides/quarter_wave_transformer
Modeling Instructions
From the File menu, choose New.
New
In the New window, click  Model Wizard.
Model Wizard
1
In the Model Wizard window, click  1D.
2
In the Select Physics tree, select Radio Frequency>Transmission Line (tl).
3
Click Add.
4
Click  Study.
5
In the Select Study tree, select General Studies>Frequency Domain.
6
Global Definitions
First add some parameters that defines the electrical and geometrical properties of the transmission lines.
Parameters 1
1
In the Model Builder window, under Global Definitions click Parameters 1.
2
In the Settings window for Parameters, locate the Parameters section.
3
50 Ω
Geometry 1
Set up the geometry as two intervals.
Interval 1 (i1)
1
In the Model Builder window, under Component 1 (comp1) right-click Geometry 1 and choose Interval.
2
In the Settings window for Interval, locate the Interval section.
3
From the Specify list, choose Interval lengths.
4
5
Click  Build All Objects.
Transmission Line (tl)
Assign the first transmission line the distributed capacitance and inductance C1 and L1, respectively.
Transmission Line Equation 1
1
In the Model Builder window, under Component 1 (comp1)>Transmission Line (tl) click Transmission Line Equation 1.
2
In the Settings window for Transmission Line Equation, locate the Transmission Line Equation section.
3
In the L text field, type L1.
4
In the C text field, type C1.
Now define the second transmission line by adding a transmission line equation feature to the second interval.
Transmission Line Equation 2
1
In the Physics toolbar, click  Domains and choose Transmission Line Equation.
2
Click the  Zoom Extents button in the Graphics toolbar to make the size of the transmission line suitable for selecting the second interval.
3
Add the electrical parameters for the second transmission line.
4
In the Settings window for Transmission Line Equation, locate the Transmission Line Equation section.
5
In the L text field, type L2.
6
In the C text field, type C2.
Replace the default absorbing boundary condition with lumped ports. With the lumped ports, it is easy to excite the transmission line and also to plot the S-parameters, that is, the reflection and transmission coefficient, for the transmission line.
Lumped Port 1
1
In the Physics toolbar, click  Boundaries and choose Lumped Port.
2
Select that this port shall be excited. You can use the default voltage for the port.
3
In the Settings window for Lumped Port, locate the Port Properties section.
4
From the Wave excitation at this port list, choose On.
Lumped Port 2
1
In the Physics toolbar, click  Boundaries and choose Lumped Port.
2
This lumped port should have a different characteristic impedance than the first lumped port and the two transmission lines.
3
In the Settings window for Lumped Port, locate the Settings section.
4
In the Zref text field, type ZL.
Mesh 1
Let the mesh have a maximum subinterval that is one tenth of the quarter-wave part of the transmission line.
1
In the Model Builder window, under Component 1 (comp1) click Mesh 1.
2
In the Settings window for Mesh, locate the Sequence Type section.
3
From the list, choose User-controlled mesh.
Size
1
In the Model Builder window, under Component 1 (comp1)>Mesh 1 click Size.
2
In the Settings window for Size, locate the Element Size section.
3
Click the Custom button.
4
Locate the Element Size Parameters section. In the Maximum element size text field, type hmax.
Study 1
Step 1: Frequency Domain
Set the frequency for the Frequency Domain study and create a first default plot.
1
In the Model Builder window, under Study 1 click Step 1: Frequency Domain.
2
In the Settings window for Frequency Domain, locate the Study Settings section.
3
In the Frequencies text field, type f.
4
In the Home toolbar, click  Compute.
Results
To clearly demonstrate that the quarter-wave transformer works, replace the plot expression with the absolute value of the voltage.
Line Graph
1
In the Model Builder window, expand the Electric Potential (tl) node, then click Line Graph.
2
In the Settings window for Line Graph, locate the y-Axis Data section.
3
In the Expression text field, type abs(V).
4
Click Replace Expression in the upper-right corner of the x-Axis Data section. From the menu, choose Component 1 (comp1)>Geometry>Coordinate>x - x-coordinate.
5
In the Electric Potential (tl) toolbar, click  Plot.
You should now have a graph as in Figure 2. Notice that the left part of the curve is flat, with a unit amplitude, indicating that there are no standing waves, despite the fact that the second lumped port has a load impedance that normally would not be matched with the transmission line.
Study 1
Step 1: Frequency Domain
Now modify the study settings to create a frequency sweep around 1 GHz, but first define the frequency sweep parameters.
Global Definitions
Parameters 1
1
In the Model Builder window, under Global Definitions click Parameters 1.
2
In the Settings window for Parameters, locate the Parameters section.
3
Study 1
Step 1: Frequency Domain
1
In the Model Builder window, under Study 1 click Step 1: Frequency Domain.
2
In the Settings window for Frequency Domain, locate the Study Settings section.
3
Click  Range.
4
In the Range dialog box, type f-df in the Start text field.
5
In the Step text field, type fstep.
6
In the Stop text field, type f+df.
7
Click Replace.
8
In the Home toolbar, click  Compute.
Results
Create a new plot group for a global plot of the S11(reflection) and S21(transmission) coefficients.
1D Plot Group 2
In the Home toolbar, click  Add Plot Group and choose 1D Plot Group.
Global 1
1
Right-click 1D Plot Group 2 and choose Global.
2
In the Settings window for Global, click Replace Expression in the upper-right corner of the y-Axis Data section. From the menu, choose Component 1 (comp1)>Transmission Line>Ports>S-parameter, dB>tl.S11dB - S11.
3
Click Add Expression in the upper-right corner of the y-Axis Data section. From the menu, choose Component 1 (comp1)>Transmission Line>Ports>S-parameter, dB>tl.S21dB - S21.
4
In the 1D Plot Group 2 toolbar, click  Plot.
Modify the y-axis limits to show that S21 actually has its maximum value for the frequency where S11 is at its minimum value.
1D Plot Group 2
1
In the Model Builder window, click 1D Plot Group 2.
2
In the Settings window for 1D Plot Group, locate the Axis section.
3
Select the Manual axis limits check box.
4
In the y minimum text field, type -30.
5
In the y maximum text field, type 2.
Move the legend panel, so it does not cover the curves.
6
Locate the Legend section. From the Position list, choose Lower right.
7
In the 1D Plot Group 2 toolbar, click  Plot.
You should now have a plot of the spectrum for S11 and S21, similar to the one in Figure 3.
Electric Potential (tl)
To demonstrate that the quarter-wave transformer only eliminates the reflection at one frequency, plot the last frequency in the first plot group.
1
In the Model Builder window, click Electric Potential (tl).
2
In the Settings window for 1D Plot Group, locate the Data section.
3
From the Parameter selection (freq) list, choose Last.
4
In the Electric Potential (tl) toolbar, click  Plot.
Notice that the curve in the left part of the plot is not flat. The sinusoidal oscillation in the absolute value of the voltage is a signature of the standing wave that appears when there is a reflection point along the transmission line. For the selected frequency the quarter-wave transformer is not a quarter-wave long and, thus, there are now reflections.
To demonstrate that the quarter-wave transformer not only should have a matched length, but also a matched characteristic impedance, set the characteristic impedance of the second lumped port to 50Ω.
Transmission Line (tl)
Lumped Port 2
1
In the Model Builder window, under Component 1 (comp1)>Transmission Line (tl) click Lumped Port 2.
2
In the Settings window for Lumped Port, locate the Settings section.
3
In the Zref text field, type 50.
Compute the spectral plot again.
Study 1
In the Home toolbar, click  Compute.
Results
Electric Potential (tl)
Select the central frequency (1 GHz) in the Electric Potential (tl) plot group.
1
In the Settings window for 1D Plot Group, locate the Data section.
2
From the Parameter selection (freq) list, choose From list.
3
In the Parameter values (freq (GHz)) list, select 1.
4
In the Electric Potential (tl) toolbar, click  Plot.
Notice that there is now a standing wave also at the center frequency.
Select the second plot group to see the spectral response.
1D Plot Group 2
Notice that there is still a resonance at the center frequency. However, as was already indicated by the spatial plot, there is considerable reflection also at the resonance frequency.