PDF

Time-Domain Modeling of Dispersive Drude–Lorentz Media
Introduction
Plasmonic hole arrays have attracted a lot of scientific interest, since the discovery of extraordinary transmission through sub-wavelength hole arrays (compare with Ref. 1). The classical Bethe theory predicts that transmittance through a sub-wavelength circular hole of diameter d in a PEC screen scales as (d/λ)4, where λ is the wavelength. Yet, transmission through holes in realistic metallic films can exceed 50% and even approach 100%. This phenomenon was attributed to surface plasmon polaritons that can tunnel electromagnetic energy through the hole even if it is very much smaller than the wavelength.
This particular model is intended as a tutorial that shows how to model the full time-dependent wave equation in dispersive media, such as plasmas and semiconductors (and any linear medium describable by a sum of Drude–Lorentz resonant terms). The dispersion of the medium in the frequency domain is assumed to be of the form
(1),
where the constant ε > 1 absorbs contributions from high-frequency contributions that are not modeled explicitly, ωp is the plasma frequency, Γi is a damping coefficient, and ωi is a resonance frequency, The particular case when the resonance frequency ωi is zero is known as plasma (or Drude medium), and it covers most metals in the optical frequency range, from mid-IR to visible. For lossless plasmas, when the damping coefficient also is zero (ωi = Γi = 0), modeling simplifies significantly since then the polarization density is linearly related to the magnetic vector potential.
In this model, the wave equation for the magnetic vector potential
(2),
where the electric displacement field is defined by
(3),
is solved together with an ordinary differential equation for the polarization field, obtained by a Fourier transformation of Equation 1,
(4).
Here f is an oscillator strength (normally set to 1).
Notice that this model is not primarily intended to demonstrate the anomalously high transmission through hole arrays, but rather to demonstrate temporal dispersion modeling.
Model Definition
The geometry consists of a single dispersive slab of thickness 1 μm with a slit of width 0.5 μm in it. The wavelength used is 1 μm. Periodic boundary conditions are applied to make the structure physically appear as an array of slits. The source of electromagnetic radiation is a plane wave pulse with flat front and Gaussian temporal shape.
Results and Discussion
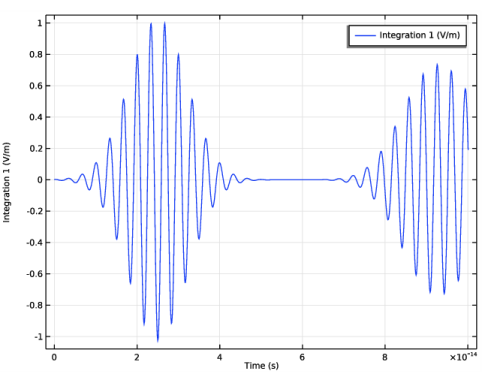
Figure 1 shows the probe plot of the y-component of the electric field at the input boundary. The left part of the curve represents the incoming wave, whereas the right part shows the reflected wave returning to the input boundary.
Figure 1: The y-component of the electric field at the input boundary. The left part shows the incident pulse and the right part shows the reflected pulse.
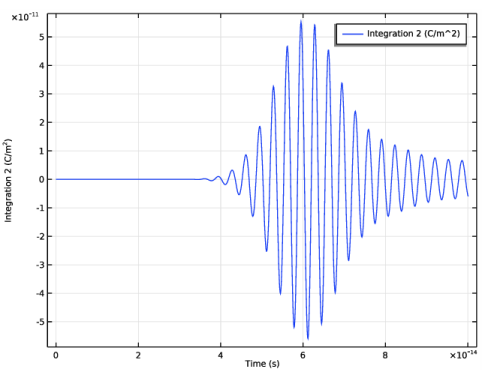
Figure 2 shows the probe plot of the y-component of the polarization at a point in the entrance of the slit. Notice the propagation delay between the incident field, shown in Figure 1, and the onset of the polarization oscillations at this point.
Figure 2: The y-component of the polarization at a point at the entrance of the slit.
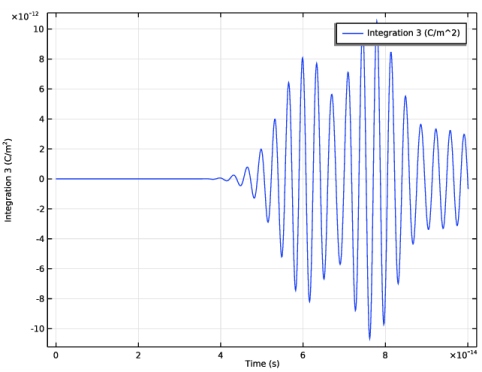
Figure 3 shows the probe plot of the y-component of the polarization field at a point at the rear end of the slit.
Figure 3: The y-component of the polarization at a point at the exit of the slit.
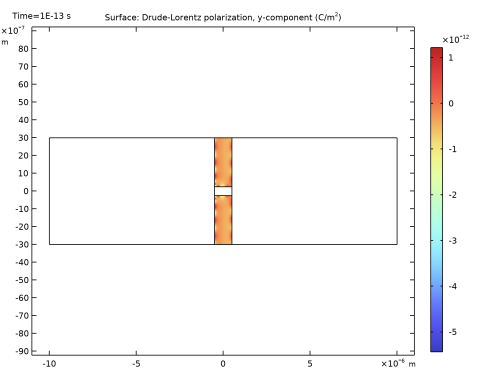
Figure 4 shows a field plot of the y-component of the polarization field after the last time step (100 fs).
Figure 4: The y-component of the polarization field after 100 fs.
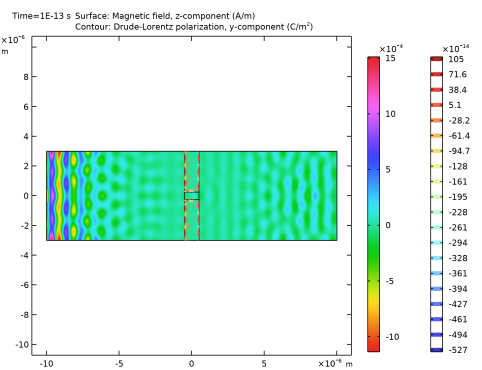
Finally, the out-of-plane component of the magnetic field and, as an overlaid contour plot, the y-component of the polarization field are shown in Figure 5, after 100 fs.
Figure 5: The out-of-plane component of the magnetic field and the y-component of the polarization field (contours) after 100 fs.
Reference
1. T.W. Ebbesen H.J. Lezec, H.F. Ghaemi, T. Thio, and P.A. Wolff, “Extraordinary Optical Transmission Through Sub-wavelength Hole Arrays,” Nature, vol. 391, pp. 667–669, 1998.
Application Library path: RF_Module/Tutorials/drude_lorentz_media
Modeling Instructions
From the File menu, choose New.
New
In the New window, click  Model Wizard.
Model Wizard
1
In the Model Wizard window, click  2D.
2
In the Select Physics tree, select Radio Frequency>Electromagnetic Waves, Transient (temw).
3
Click Add.
4
Click  Study.
5
In the Select Study tree, select General Studies>Time Dependent.
6
Global Definitions
Parameters 1
Add some parameters that will define the geometry and the properties of the incident field.
1
In the Model Builder window, under Global Definitions click Parameters 1.
2
In the Settings window for Parameters, locate the Parameters section.
3
Definitions
Variables 1
1
In the Model Builder window, under Component 1 (comp1) right-click Definitions and choose Variables.
Now add some variables that defines the incident field and the material properties.
2
In the Settings window for Variables, locate the Variables section.
3
Geometry 1
The geometry is simple, consisting of only three centered rectangles.
Rectangle 1 (r1)
1
In the Geometry toolbar, click  Rectangle.
2
In the Settings window for Rectangle, locate the Size and Shape section.
3
In the Width text field, type lda0.
4
In the Height text field, type 6*lda0.
5
Locate the Position section. From the Base list, choose Center.
Rectangle 2 (r2)
1
Right-click Rectangle 1 (r1) and choose Duplicate.
2
In the Settings window for Rectangle, locate the Size and Shape section.
3
In the Width text field, type 20*lda0.
Rectangle 3 (r3)
1
In the Model Builder window, under Component 1 (comp1)>Geometry 1 right-click Rectangle 1 (r1) and choose Duplicate.
2
In the Settings window for Rectangle, locate the Size and Shape section.
3
In the Height text field, type 0.5*lda0.
4
Click  Build All Objects.
5
Click the  Zoom Extents button in the Graphics toolbar.
Definitions
Now, add three integration operators that will be used for probing the field and the polarization in three different points.
Integration 1 (intop1)
1
In the Definitions toolbar, click  Nonlocal Couplings and choose Integration.
2
In the Settings window for Integration, locate the Source Selection section.
3
From the Geometric entity level list, choose Point.
4
Integration 2 (intop2)
1
In the Definitions toolbar, click  Nonlocal Couplings and choose Integration.
2
In the Settings window for Integration, locate the Source Selection section.
3
From the Geometric entity level list, choose Point.
4
Integration 3 (intop3)
1
In the Definitions toolbar, click  Nonlocal Couplings and choose Integration.
2
In the Settings window for Integration, locate the Source Selection section.
3
From the Geometric entity level list, choose Point.
4
Electromagnetic Waves, Transient (temw)
1
In the Model Builder window, under Component 1 (comp1) click Electromagnetic Waves, Transient (temw).
2
In the Settings window for Electromagnetic Waves, Transient, locate the Components section.
3
From the Electric field components solved for list, choose In-plane vector, to solve only for the in-plane components of the field.
Wave Equation, Electric 1
Define the first wave equation feature to use the Drude-Lorentz dispersion model. Later you will add another wave equation feature for the air domain.
1
In the Model Builder window, under Component 1 (comp1)>Electromagnetic Waves, Transient (temw) click Wave Equation, Electric 1.
2
In the Settings window for Wave Equation, Electric, locate the Electric Displacement Field section.
3
From the Electric displacement field model list, choose Drude-Lorentz dispersion model.
4
From the Relative permittivity, high frequency list, choose Diagonal.
5
In the Relative permittivity, high frequency table, enter 4 for the two first diagonal elements and keep 1 for the last one.
6
In the ωP text field, type omega_p.
7
Locate the Magnetic Field section. From the μr list, choose User defined. Accept the default value 1.
8
Locate the Conduction Current section. From the σ list, choose User defined. Accept the default value 0.
Drude-Lorentz Polarization 1
Next, you add a Drude-Lorentz Polarization feature, as a subfeature to the wave equation. There, more material parameters will be defined for the polarization field.
1
In the Physics toolbar, click  Attributes and choose Drude-Lorentz Polarization.
2
In the Settings window for Drude-Lorentz Polarization, locate the Drude-Lorentz Dispersion Model section.
3
In the fn text field, type 1.
4
In the ωn text field, type omega_1.
5
In the Γn text field, type gamma_1.
Wave Equation, Electric 2
1
In the Physics toolbar, click  Domains and choose Wave Equation, Electric.
2
3
In the Settings window for Wave Equation, Electric, locate the Electric Displacement Field section.
4
From the εr list, choose User defined. Locate the Magnetic Field section. From the μr list, choose User defined. Locate the Conduction Current section. From the σ list, choose User defined.
Scattering Boundary Condition 1
Use scattering boundary conditions to excite the wave and to absorb it.
1
In the Physics toolbar, click  Boundaries and choose Scattering Boundary Condition.
2
In the Settings window for Scattering Boundary Condition, locate the Scattering Boundary Condition section.
3
From the Incident field list, choose Wave given by E field.
4
5
Specify the E0 vector as
Scattering Boundary Condition 2
1
In the Physics toolbar, click  Boundaries and choose Scattering Boundary Condition.
2
Periodic Condition 1
To model a hole array, periodic boundary conditions will be used.
1
In the Physics toolbar, click  Boundaries and choose Periodic Condition.
2
Mesh 1
Since a periodic boundary condition is used, the mesh should also be the same on the top and bottom edge. Thus, add first an edge mesh and copy the mesh points to the opposite edge. Then add a triangular mesh.
Edge 1
1
In the Mesh toolbar, click  Edge.
2
Copy Edge 1
1
In the Model Builder window, right-click Mesh 1 and choose Copying Operations>Copy Edge.
2
3
In the Settings window for Copy Edge, locate the Destination Boundaries section.
4
Click to select the  Activate Selection toggle button.
5
Now, you should have the source (top) and destination (bottom) selections, as shown below.
Free Triangular 1
In the Mesh toolbar, click  Free Triangular.
Size
1
In the Model Builder window, click Size.
2
In the Settings window for Size, locate the Element Size section.
3
Click the Custom button.
4
Locate the Element Size Parameters section. In the Maximum element size text field, type lda0/6.
5
Click  Build All.
Study 1
Step 1: Time Dependent
1
In the Model Builder window, under Study 1 click Step 1: Time Dependent.
2
In the Settings window for Time Dependent, locate the Study Settings section.
3
In the Output times text field, type range(0,10[fs],100[fs]).
Solution 1 (sol1)
1
In the Study toolbar, click  Show Default Solver, to be able to make some modifications of the solver settings.
Force the solver to use a fixed small step size that resolves the temporal field oscillations.
2
In the Model Builder window, expand the Solution 1 (sol1) node, then click Time-Dependent Solver 1.
3
In the Settings window for Time-Dependent Solver, click to expand the Time Stepping section.
4
From the Steps taken by solver list, choose Manual.
5
In the Time step text field, type 0.1[fs].
Definitions
Before computing the solution, define the three Global Variable Probes that can be used for monitoring the computation progress.
Global Variable Probe 1 (var1)
1
In the Definitions toolbar, click  Probes and choose Global Variable Probe.
2
In the Settings window for Global Variable Probe, locate the Expression section.
3
In the Expression text field, type intop1(temw.Ey).
4
Click to expand the Table and Window Settings section.
Global Variable Probe 2 (var2)
1
In the Definitions toolbar, click  Probes and choose Global Variable Probe.
2
In the Settings window for Global Variable Probe, locate the Expression section.
3
In the Expression text field, type intop2(temw.Poscy).
4
Locate the Table and Window Settings section. From the Plot window list, choose New window.
Global Variable Probe 3 (var3)
1
In the Definitions toolbar, click  Probes and choose Global Variable Probe.
2
In the Settings window for Global Variable Probe, locate the Expression section.
3
In the Expression text field, type intop3(temw.Poscy).
4
Locate the Table and Window Settings section. From the Plot window list, choose New window.
5
In the Home toolbar, click  Compute.
Results
Surface 1
Modify this surface plot to show the y component of the Drude-Lorentz polarization.
1
In the Model Builder window, expand the 2D Plot Group 1 node, then click Surface 1.
2
In the Settings window for Surface, locate the Expression section.
3
In the Expression text field, type temw.Poscy.
4
In the 2D Plot Group 1 toolbar, click  Plot.
5
Click the  Zoom Extents button in the Graphics toolbar.
Probe Plot Group 2
The first probe plot should look like the one above.
Probe Plot Group 3
The second probe plot should look like the one above.
Probe Plot Group 4
Finally, the third probe plot should look like the one above.
2D Plot Group 5
Now, add a surface plot of the z component of the magnetic field and overlay a contour plot of the y component of the Drude-Lorentz polarization.
In the Home toolbar, click  Add Plot Group and choose 2D Plot Group.
Surface 1
1
Right-click 2D Plot Group 5 and choose Surface.
2
In the Settings window for Surface, locate the Expression section.
3
In the Expression text field, type temw.Hz.
4
Locate the Coloring and Style section. Click  Change Color Table.
5
In the Color Table dialog box, select Rainbow>Cyclic in the tree.
6
Contour 1
1
In the Model Builder window, right-click 2D Plot Group 5 and choose Contour.
2
In the Settings window for Contour, locate the Expression section.
3
In the Expression text field, type temw.Poscy.
4
In the 2D Plot Group 5 toolbar, click  Plot.
5
Click the  Zoom Extents button in the Graphics toolbar.