PDF

Shell Conduction
Introduction
The following example illustrates how to build and solve a model using the Heat Transfer in Shells interface. This example is a 2D NAFEMS benchmark (Ref. 1), which was transformed to 3D.
Model Definition
Figure 1 describes the 2D benchmark example.
Figure 1: A 2D benchmark example for a thin conductive shell.
The 3D model bends this plate so that it becomes a quarter of a cylinder (Figure 2).
Figure 2: The 3D geometry based on the 2D model.
Results
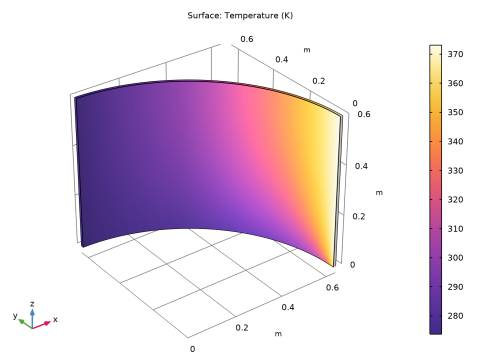
The temperature at point A in Figure 2 (291.40 K) is in agreement with that from the NAFEMS benchmark (Ref. 1). Figure 3 shows the temperature distribution.
Figure 3: The resulting temperature field of the 3D model.
Reference
1. J.A. Casey and G.B Simpson, “Two-dimensional Steady State,” Benchmark Tests for Thermal Analysis, NAFEMS, Test 10, p. 2.9, 1986.
Application Library path: Heat_Transfer_Module/Tutorials,_Thin_Structure/shell_conduction
Modeling Instructions
From the File menu, choose New.
New
In the New window, click  Model Wizard.
Model Wizard
1
In the Model Wizard window, click  3D.
2
In the Select Physics tree, select Heat Transfer>Thin Structures>Heat Transfer in Shells (htlsh).
3
Click Add.
4
Click  Study.
5
In the Select Study tree, select General Studies>Stationary.
6
Global Definitions
Parameters 1
1
In the Model Builder window, under Global Definitions click Parameters 1.
2
In the Settings window for Parameters, locate the Parameters section.
3
Geometry 1
Cylinder 1 (cyl1)
1
In the Geometry toolbar, click  Cylinder.
2
In the Settings window for Cylinder, locate the Object Type section.
3
From the Type list, choose Surface.
4
Locate the Size and Shape section. In the Radius text field, type 2/pi.
5
In the Height text field, type 0.6.
6
Click  Build Selected.
Delete Entities 1 (del1)
1
In the Model Builder window, right-click Geometry 1 and choose Delete Entities.
2
On the object cyl1, select Boundaries 1–3 only.
3
In the Settings window for Delete Entities, click  Build Selected.
4
Click the  Zoom Extents button in the Graphics toolbar.
Point 1 (pt1)
1
In the Geometry toolbar, click  More Primitives and choose Point.
2
In the Settings window for Point, locate the Point section.
3
In the x text field, type (2/pi)*cos(pi*18/180).
4
In the y text field, type (2/pi)*sin(pi*18/180).
This step embeds the point where you compare the calculated solution with the benchmark.
5
Click  Build Selected.
Materials
Material 1 (mat1)
1
In the Materials toolbar, click  Blank Material.
2
In the Settings window for Material, locate the Material Contents section.
3
Heat Transfer in Shells (htlsh)
Temperature 1
1
In the Model Builder window, under Component 1 (comp1) right-click Heat Transfer in Shells (htlsh) and choose Temperature.
2
3
In the Settings window for Temperature, locate the Temperature section.
4
In the T0 text field, type T_edge.
Heat Flux 1
1
In the Physics toolbar, click  Edges and choose Heat Flux.
2
3
In the Settings window for Heat Flux, locate the Heat Flux section.
4
From the Flux type list, choose Convective heat flux.
5
In the h text field, type ht.
6
In the Text text field, type T_ext.
Mesh 1
Mapped 1
1
In the Mesh toolbar, click  Boundary and choose Mapped.
2
3
In the Settings window for Mapped, click  Build All.
Study 1
In the Home toolbar, click  Compute.
Results
Temperature (htlsh)
The default plot is the surface plot of the temperature. Compare with Figure 3.
Follow the steps below to obtain the temperature at the benchmark verification point.
Point Evaluation 1
1
In the Results toolbar, click  Point Evaluation.
2
3
In the Settings window for Point Evaluation, click  Evaluate.
The result shown in the Table window below the Graphics window should be approximately 291.4 K.