PDF

Triaxial and Oedometer Test with Modified Cam-Clay Material Model
Introduction
The Modified Cam-Clay (MCC) model is a popular constitutive model for soft soils and clays. The MCC model has a nonlinear relation between stress and strain with a smooth yield surface. In this example, simulations of triaxial tests are carried out to examine the constitutive relation of the MCC model, as it is originally developed for triaxial loading conditions. The oedometer test is also an important test in the field of geomechanics, which is used frequently to determine the material parameters of soils. In this example, the drained triaxial compression test and the oedometer test presented in Ref. 1 are simulated.
The Cam-Clay family of models do not have any stiffness at zero stress; hence, it always starts with an initial mean stress. In COMSOL Multiphysics, the initial mean stress of the MCC model is equal to the reference pressure. The MCC model comes in two flavors: it either requires the specification of a constant shear modulus or a constant Poisson’s ratio. In this example, the constant Poisson’s ratio formulation is used in order to match the results in Ref. 1. Although the analysis presented in Ref. 1 is transient, a stationary analysis is sufficient to predict the behavior.
Model Definition
In both the triaxial and oedometer tests, a cylindrical soil specimen of 3.91 cm in diameter and 8 cm in height is used. For the triaxial test (see Figure 1), a confinement pressure is applied to create a state of isotropic compression, and later the soil sample is compressed axially. For the oedometer test, the bottom and side boundaries of the cylindrical specimen are constrained in the normal direction and an axial load is applied on the top boundary.
Soil Properties
The soil properties for the MCC material model as given in Ref. 1 are
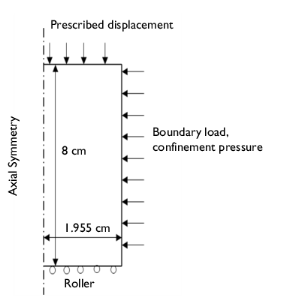
Density ρ = 2400 kg/m3, Poisson’s ratio ν = 0.35, slope of critical state line M = 1.2, swelling index κ = 0.02, compression index λ = 0.1, void ratio eref = 1 at a reference pressure pref = 98 kPa, and initial consolidation pressure pc0 = 100 kPa or 500 kPa.
.
Figure 1: Dimensions, boundary conditions, and boundary loads for the triaxial test.
Constraints and Loads
Results and Discussion
Note that for the sake of consistency with geomechanics conventions, the compressive axial stress and strain are plotted along the positive axis, whereas the tensile stress and strain are plotted along the negative axis in all the figures. The response of the MCC model with different overconsolidation ratios (OCRs) are plotted in the same figures for comparison purposes.
The OCR is a ratio between the initial consolidation pressure to the initial mean effective stress. For the oedometer test in Ref. 1, the OCR is the ratio of the initial consolidation pressure to the initial vertical load. A soil with an OCR equal to 1 is referred to as normally consolidated. When the OCR is equal to 5 or 50, the soil is instead referred to as highly overconsolidated.
The variation in von Mises stress versus axial strain with different OCRs is shown in Figure 2. The stress-strain curve is nonlinear, which is a characteristic of the MCC model. As the axial displacement increases, the von Mises stress increases hyperbolically and approaches a critical state asymptotically. When the soil attains the critical state, additional loading does not produce any volume changes or hardening. The response of the soil in Figure 2 matches very closely with the numerical results given in Ref. 1 (see Figure 7 in Ref. 1).
Figure 2: von Mises stress versus axial strain.
The variation in the total volumetric strain versus the axial strain with different OCRs can be seen in Figure 3, which matches very closely with the numerical results given in Ref. 1 (see Figure 8 in Ref. 1). For normally consolidated soils (OCR = 1), the total volumetric strain remains compressive. In contrast, the volumetric response for highly overconsolidated soils turns tensile after an initial compressive phase. This counterintuitive behavior can be further explained by Figure 4 and Figure 5.
Figure 3: Volumetric strain versus axial strain.
The evolution of the consolidation pressure and the volumetric plastic strains is shown in Figure 4 and Figure 5, respectively. For normally consolidated soils, the consolidation pressure increases, indicating that the final yield envelope is expanding. This, in turn, gives compressive volumetric plastic strains, see Figure 5. This behavior is called isotropic hardening. For highly overconsolidated soils, the consolidation pressure is decreasing, indicating the shrinking of the final yield envelope, which in turn develops tensile volumetric plastic strains, see Figure 5. This behavior called isotropic softening
Figure 4: Consolidation pressure versus axial strain.
In COMSOL Multiphysics, the reference pressure acts as an initial stress and needs to be nonzero. For the oedometer test in Ref. 1, there seems to be no initial stress. Hence, for the corresponding test in COMSOL Multiphysics, set the reference pressure to 1 kPa. The void ratio at the reference pressure is calculated based on its value at 98 kPa as
The variation in the void ratio versus the logarithm of the vertical load for the highly overconsolidated soil in the oedometer test is plotted in Figure 6, which matches qualitatively with numerical results given in Ref. 1 (see Figure 6 in Ref. 1). The slight difference in the results can be due to the different initial conditions.
The variation in the total volumetric strain versus the axial load for the highly overconsolidated soil in the oedometer test can be seen in Figure 7. When the yield limit is reached, the response is nonsmooth.
Figure 5: Volumetric plastic strain versus axial strain.
Figure 6: Void ratio versus the axial load (log-scale).
Figure 7: Volumetric strain versus axial load.
Notes About the COMSOL Implementation
In COMSOL Multiphysics, the MCC model comes in two flavors: it either requires specification of constant shear modulus or a constant Poisson’s ratio. For the constant shear modulus option, the Poisson’s ratio is computed based on the bulk modulus and the given shear modulus. This Poisson’s ratio depends on deformation, but does not enter into the constitutive relation and remains only as a postprocessing variable. For the constant Poisson’s ratio option, the shear modulus is calculated from the bulk modulus and the Poisson’s ratio. This variable shear modulus does enter into the constitutive relation.
The in-situ stresses are the stresses in the soil sample in the strain-free configuration. There are two methods to account for in-situ stresses in COMSOL Multiphysics. One method is to create two stationary study steps or studies, with a combination of Initial Stress and Strain and External Stress nodes. The second method is to use the in-situ stress option in an External Stress node with single study, which gives initial stresses in the soil sample without any strain. In this example, the second method is used to model the initial/in-situ stresses in the triaxial test.
Reference
1. G. Ye and B. Ye, “Investigation of the Overconsolidation and Structural Behavior of Shanghai Clays by Element Testing and Constitutive Modeling,” Underground Space, vol. 1, pp. 62-77, 2016.
Application Library path: Geomechanics_Module/Verification_Examples/triaxial_and_oedometer_test_mcc
Modeling Instructions
From the File menu, choose New.
New
In the New window, click  Model Wizard.
Model Wizard
1
In the Model Wizard window, click  2D Axisymmetric.
2
In the Select Physics tree, select Structural Mechanics>Solid Mechanics (solid).
3
Click Add.
4
Click  Study.
5
In the Select Study tree, select General Studies>Stationary.
6
Global Definitions
Parameters 1
1
In the Model Builder window, under Global Definitions click Parameters 1.
2
In the Settings window for Parameters, locate the Parameters section.
3
Add variables for the reference void ratio and the reference pressure, which are different for the two tests.
Definitions
Variables 1
1
In the Model Builder window, under Component 1 (comp1) right-click Definitions and choose Variables.
2
In the Settings window for Variables, locate the Variables section.
3
Geometry 1
Rectangle 1 (r1)
1
In the Geometry toolbar, click  Rectangle.
2
In the Settings window for Rectangle, locate the Size and Shape section.
3
In the Width text field, type 1.955[cm].
4
In the Height text field, type 8[cm].
5
Click  Build Selected.
Solid Mechanics (solid)
Modified Cam-Clay Material Model
1
In the Model Builder window, under Component 1 (comp1) right-click Solid Mechanics (solid) and choose Material Models>Elastoplastic Soil Material.
2
In the Settings window for Elastoplastic Soil Material, type Modified Cam-Clay Material Model in the Label text field.
3
4
Locate the Elastoplastic Soil Material section. From the eref list, choose User defined. In the associated text field, type e_ref.
5
In the pref text field, type p_ref.
6
In the pc0 text field, type 100[kPa]*OCR.
The triaxial test is carried out in two steps. The first step is needed to get the initial stress state of the sample, and the second step is an axial compressive loading. The initial stress state can be modeled using the In situ stress option of the External Stress node.
External Stress [Triaxial Test]
1
In the Physics toolbar, click  Attributes and choose External Stress.
2
In the Settings window for External Stress, type External Stress [Triaxial Test] in the Label text field.
3
Locate the External Stress section. From the Stress input list, choose In situ stress.
4
In the σins text field, type -p0.
Roller [Triaxial Test]
1
In the Physics toolbar, click  Boundaries and choose Roller.
2
In the Settings window for Roller, type Roller [Triaxial Test] in the Label text field.
3
Prescribed Displacement [Triaxial Test]
1
In the Physics toolbar, click  Boundaries and choose Prescribed Displacement.
2
In the Settings window for Prescribed Displacement, type Prescribed Displacement [Triaxial Test] in the Label text field.
3
4
Locate the Prescribed Displacement section. Select the Prescribed in z direction check box.
5
In the u0z text field, type disp.
Roller [Oedometer Test]
1
In the Physics toolbar, click  Boundaries and choose Roller.
2
3
In the Settings window for Roller, type Roller [Oedometer Test] in the Label text field.
Boundary Load [Oedometer Test]
1
In the Physics toolbar, click  Boundaries and choose Boundary Load.
2
3
In the Settings window for Boundary Load, locate the Force section.
4
From the Load type list, choose Pressure.
5
In the p text field, type F.
6
In the Label text field, type Boundary Load [Oedometer Test].
Materials
Soil Material
1
In the Model Builder window, under Component 1 (comp1) right-click Materials and choose Blank Material.
2
In the Settings window for Material, type Soil Material in the Label text field.
3
Locate the Material Contents section. In the table, enter the following settings:
One element is sufficient for this analysis.
Mesh 1
Mapped 1
In the Mesh toolbar, click  Mapped.
Distribution 1
1
Right-click Mapped 1 and choose Distribution.
2
In the Settings window for Distribution, locate the Boundary Selection section.
3
From the Selection list, choose All boundaries.
4
Locate the Distribution section. In the Number of elements text field, type 1.
5
Click  Build Selected.
Disable the features that are not needed in this study.
Study: Triaxial Test
Disable the default plots for this study.
1
In the Model Builder window, click Study 1.
2
In the Settings window for Study, type Study: Triaxial Test in the Label text field.
3
Locate the Study Settings section. Clear the Generate default plots check box.
Disable the features that are not needed in this study.
Step 1: Stationary
1
In the Model Builder window, under Study: Triaxial Test click Step 1: Stationary.
2
In the Settings window for Stationary, locate the Physics and Variables Selection section.
3
Select the Modify model configuration for study step check box.
4
In the tree, select Component 1 (comp1)>Solid Mechanics (solid)>Roller [Oedometer Test] and Component 1 (comp1)>Solid Mechanics (solid)>Boundary Load [Oedometer Test].
5
6
Click to expand the Study Extensions section. Select the Auxiliary sweep check box.
7
8
Add a Parametric Sweep node to study the soil specimen for different OCRs.
Parametric Sweep
1
In the Study toolbar, click  Parametric Sweep.
2
In the Settings window for Parametric Sweep, locate the Study Settings section.
3
4
5
In the Study toolbar, click  Compute.
Add a second study for the axial compression step in the oedometer test.
Add Study
1
In the Study toolbar, click  Add Study to open the Add Study window.
2
Go to the Add Study window.
3
Find the Studies subsection. In the Select Study tree, select General Studies>Stationary.
4
Click Add Study in the window toolbar.
5
In the Study toolbar, click  Add Study to close the Add Study window.
Disable the features that are not needed in this study.
Study: Oedometer Test
Disable the default plots for this study.
1
In the Model Builder window, click Study 2.
2
In the Settings window for Study, locate the Study Settings section.
3
Clear the Generate default plots check box.
4
In the Label text field, type Study: Oedometer Test.
5
In the Study toolbar, click  Parametric Sweep.
Parametric Sweep
1
In the Settings window for Parametric Sweep, locate the Study Settings section.
2
3
Step 1: Stationary
1
In the Model Builder window, click Step 1: Stationary.
2
In the Settings window for Stationary, locate the Physics and Variables Selection section.
3
Select the Modify model configuration for study step check box.
4
In the tree, select Component 1 (comp1)>Solid Mechanics (solid)>Modified Cam-Clay Material Model>External Stress [Triaxial Test], Component 1 (comp1)>Solid Mechanics (solid)>Roller [Triaxial Test], and Component 1 (comp1)>Solid Mechanics (solid)>Prescribed Displacement [Triaxial Test].
5
6
Locate the Study Extensions section. Select the Auxiliary sweep check box.
7
8
9
In the Study toolbar, click  Compute.
Results
Mises Stress vs. Axial Strain [Triaxial Test]
1
In the Home toolbar, click  Add Plot Group and choose 1D Plot Group.
2
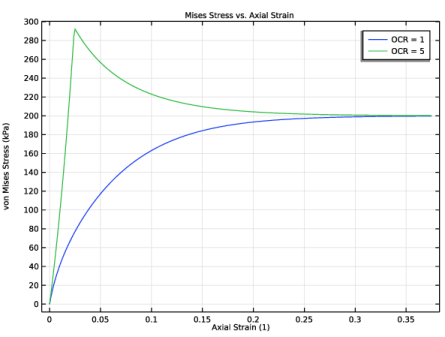
In the Settings window for 1D Plot Group, type Mises Stress vs. Axial Strain [Triaxial Test] in the Label text field.
3
Click to expand the Title section. From the Title type list, choose Manual.
4
In the Title text area, type Mises Stress vs. Axial Strain.
5
Locate the Plot Settings section.
6
Select the x-axis label check box. In the associated text field, type Axial Strain (1).
7
Select the y-axis label check box. In the associated text field, type von Mises Stress (kPa).
Point Graph 1
1
Right-click Mises Stress vs. Axial Strain [Triaxial Test] and choose Point Graph.
2
In the Settings window for Point Graph, locate the Data section.
3
From the Dataset list, choose Study: Triaxial Test/Parametric Solutions 1 (sol2).
4
From the Parameter selection (OCR) list, choose First.
5
6
Locate the y-Axis Data section. In the Expression text field, type solid.mises.
7
From the Unit list, choose kPa.
8
Locate the x-Axis Data section. From the Parameter list, choose Expression.
9
In the Expression text field, type -solid.eZZ.
10
Click to expand the Legends section. Select the Show legends check box.
11
From the Legends list, choose Manual.
12
Point Graph 2
1
Right-click Point Graph 1 and choose Duplicate.
2
In the Settings window for Point Graph, locate the Data section.
3
From the Parameter selection (OCR) list, choose Last.
4
Locate the Legends section. In the table, enter the following settings:
5
In the Mises Stress vs. Axial Strain [Triaxial Test] toolbar, click  Plot.
Volumetric Strain vs. Axial Strain [Triaxial Test]
1
In the Home toolbar, click  Add Plot Group and choose 1D Plot Group.
2
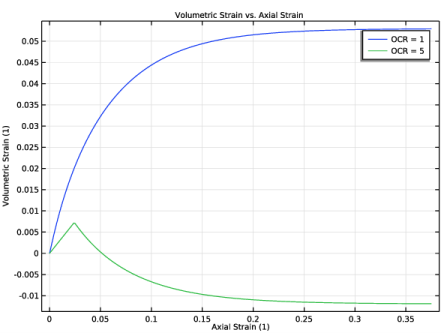
In the Settings window for 1D Plot Group, type Volumetric Strain vs. Axial Strain [Triaxial Test] in the Label text field.
3
Locate the Title section. From the Title type list, choose Manual.
4
In the Title text area, type Volumetric Strain vs. Axial Strain.
5
Locate the Plot Settings section.
6
Select the x-axis label check box. In the associated text field, type Axial Strain (1).
7
Select the y-axis label check box. In the associated text field, type Volumetric Strain (1).
Point Graph 1
1
Right-click Volumetric Strain vs. Axial Strain [Triaxial Test] and choose Point Graph.
2
In the Settings window for Point Graph, locate the Data section.
3
From the Dataset list, choose Study: Triaxial Test/Parametric Solutions 1 (sol2).
4
From the Parameter selection (OCR) list, choose First.
5
6
Locate the y-Axis Data section. In the Expression text field, type -solid.evol.
7
Locate the x-Axis Data section. From the Parameter list, choose Expression.
8
In the Expression text field, type -solid.eZZ.
9
Locate the Legends section. Select the Show legends check box.
10
From the Legends list, choose Manual.
11
Point Graph 2
1
Right-click Point Graph 1 and choose Duplicate.
2
In the Settings window for Point Graph, locate the Data section.
3
From the Parameter selection (OCR) list, choose Last.
4
5
Locate the Legends section. In the table, enter the following settings:
6
In the Volumetric Strain vs. Axial Strain [Triaxial Test] toolbar, click  Plot.
Consolidation Pressure vs. Axial Strain [Triaxial Test]
1
In the Home toolbar, click  Add Plot Group and choose 1D Plot Group.
2
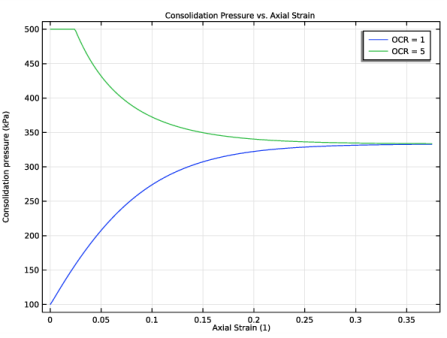
In the Settings window for 1D Plot Group, type Consolidation Pressure vs. Axial Strain [Triaxial Test] in the Label text field.
3
Locate the Title section. From the Title type list, choose Manual.
4
In the Title text area, type Consolidation Pressure vs. Axial Strain.
5
Locate the Plot Settings section.
6
Select the x-axis label check box. In the associated text field, type Axial Strain (1).
7
Select the y-axis label check box. In the associated text field, type Consolidation pressure (kPa).
Point Graph 1
1
Right-click Consolidation Pressure vs. Axial Strain [Triaxial Test] and choose Point Graph.
2
In the Settings window for Point Graph, locate the Data section.
3
From the Dataset list, choose Study: Triaxial Test/Parametric Solutions 1 (sol2).
4
From the Parameter selection (OCR) list, choose First.
5
6
Click Replace Expression in the upper-right corner of the y-Axis Data section. From the menu, choose Component 1 (comp1)>Solid Mechanics>Soil material properties>Modified Cam-Clay>solid.epsm1.pc - Consolidation pressure - Pa.
7
Locate the y-Axis Data section. From the Unit list, choose kPa.
8
Locate the x-Axis Data section. From the Parameter list, choose Expression.
9
In the Expression text field, type -solid.eZZ.
10
Locate the Legends section. Select the Show legends check box.
11
From the Legends list, choose Manual.
12
Point Graph 2
1
Right-click Point Graph 1 and choose Duplicate.
2
In the Settings window for Point Graph, locate the Data section.
3
From the Parameter selection (OCR) list, choose Last.
4
5
Locate the Legends section. In the table, enter the following settings:
6
In the Consolidation Pressure vs. Axial Strain [Triaxial Test] toolbar, click  Plot.
Volumetric Plastic Strain vs. Axial Strain [Triaxial Test]
1
In the Home toolbar, click  Add Plot Group and choose 1D Plot Group.
2
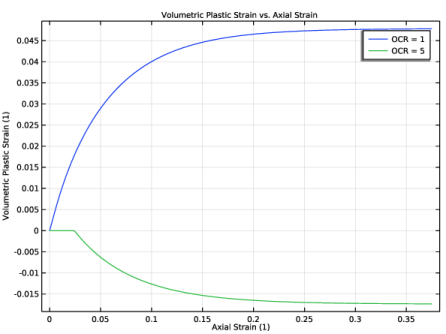
In the Settings window for 1D Plot Group, type Volumetric Plastic Strain vs. Axial Strain [Triaxial Test] in the Label text field.
3
Locate the Title section. From the Title type list, choose Manual.
4
In the Title text area, type Volumetric Plastic Strain vs. Axial Strain.
5
Locate the Plot Settings section.
6
Select the x-axis label check box. In the associated text field, type Axial Strain (1).
7
Select the y-axis label check box. In the associated text field, type Volumetric Plastic Strain (1).
Point Graph 1
1
Right-click Volumetric Plastic Strain vs. Axial Strain [Triaxial Test] and choose Point Graph.
2
In the Settings window for Point Graph, locate the Data section.
3
From the Dataset list, choose Study: Triaxial Test/Parametric Solutions 1 (sol2).
4
From the Parameter selection (OCR) list, choose First.
5
6
Locate the y-Axis Data section. In the Expression text field, type -solid.epvol.
7
Locate the x-Axis Data section. From the Parameter list, choose Expression.
8
In the Expression text field, type -solid.eZZ.
9
Locate the Legends section. Select the Show legends check box.
10
From the Legends list, choose Manual.
11
Point Graph 2
1
Right-click Point Graph 1 and choose Duplicate.
2
In the Settings window for Point Graph, locate the Data section.
3
From the Parameter selection (OCR) list, choose Last.
4
5
Locate the Legends section. In the table, enter the following settings:
6
In the Volumetric Plastic Strain vs. Axial Strain [Triaxial Test] toolbar, click  Plot.
Void Ratio vs. Axial Load [Oedometer Test]
1
In the Home toolbar, click  Add Plot Group and choose 1D Plot Group.
2
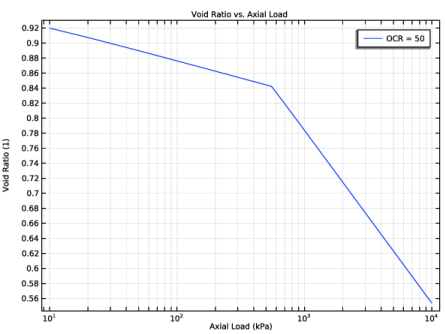
In the Settings window for 1D Plot Group, type Void Ratio vs. Axial Load [Oedometer Test] in the Label text field.
3
Locate the Data section. From the Dataset list, choose Study: Oedometer Test/Parametric Solutions 2 (sol6).
4
Locate the Title section. From the Title type list, choose Manual.
5
In the Title text area, type Void Ratio vs. Axial Load.
6
Locate the Plot Settings section.
7
Select the x-axis label check box. In the associated text field, type Axial Load (kPa).
8
Select the y-axis label check box. In the associated text field, type Void Ratio (1).
9
Locate the Axis section. Select the x-axis log scale check box.
Point Graph 1
1
Right-click Void Ratio vs. Axial Load [Oedometer Test] and choose Point Graph.
2
3
In the Settings window for Point Graph, click Replace Expression in the upper-right corner of the y-Axis Data section. From the menu, choose Component 1 (comp1)>Solid Mechanics>Soil material properties>Modified Cam-Clay>solid.epsm1.evoid - Void ratio.
4
Locate the x-Axis Data section. From the Parameter list, choose Expression.
5
In the Expression text field, type F.
6
From the Unit list, choose kPa.
7
Locate the Legends section. Select the Show legends check box.
8
From the Legends list, choose Manual.
9
10
In the Void Ratio vs. Axial Load [Oedometer Test] toolbar, click  Plot.
Volumetric Strain vs. Axial Load [Oedometer Test]
1
In the Home toolbar, click  Add Plot Group and choose 1D Plot Group.
2
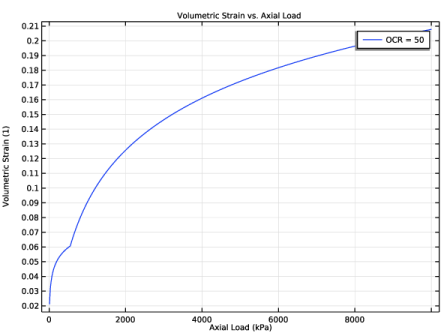
In the Settings window for 1D Plot Group, type Volumetric Strain vs. Axial Load [Oedometer Test] in the Label text field.
3
Locate the Data section. From the Dataset list, choose Study: Oedometer Test/Parametric Solutions 2 (sol6).
4
Locate the Title section. From the Title type list, choose Manual.
5
In the Title text area, type Volumetric Strain vs. Axial Load.
6
Locate the Plot Settings section.
7
Select the x-axis label check box. In the associated text field, type Axial Load (kPa).
8
Select the y-axis label check box. In the associated text field, type Volumetric Strain (1).
Point Graph 1
1
Right-click Volumetric Strain vs. Axial Load [Oedometer Test] and choose Point Graph.
2
3
In the Settings window for Point Graph, locate the y-Axis Data section.
4
In the Expression text field, type -solid.evol.
5
Locate the x-Axis Data section. From the Parameter list, choose Expression.
6
In the Expression text field, type F.
7
From the Unit list, choose kPa.
8
Locate the Legends section. Select the Show legends check box.
9
From the Legends list, choose Manual.
10
11
In the Volumetric Strain vs. Axial Load [Oedometer Test] toolbar, click  Plot.