PDF

Fermentation in Beer Brewing
Introduction
An important step in brewing beer is the fermentation process. Here, alcohol is formed together with various flavor substances from sugars in the presence of yeast. The initial sugar content, temperature, and yeast type dictate how the fermentation proceeds.
This model consists of two parts. In the first part the fermentation process is efficiently modeled using the Reaction Engineering interface, assuming that the reaction rate is neither mass- nor heat-transfer limited, that is, the system is perfectly mixed.
In the second part of this model, the perfectly mixed model in part 1 is expanded into a sphero-conical tank model accounting for mass transfer, heat transfer and natural convection. In both model setups, it is possible to evaluate several parameters affecting the final alcohol content and taste of the beer. The perfectly mixed example reproduces results in Ref. 1 and Ref. 2.
Model Definition
When brewing beer, the fermentation step is subsequent of malting and mashing, and involves the conversion of sugars to alcohol. The previous steps cover wetting and drying of barley grains to form malt, followed by boiling and mixing the malt, to create a sugary liquid called wort. The fermentation starts as soon as the wort has been cooled down (< 20°C) and yeast has been added to it.
The fermentation usually takes place in a closed tank under anaerobic conditions. The time frame for the fermentation is weeks, but may vary considerably depending on the yeast type and fermentation temperature. The sugar content is mainly made up of three types of sugars: maltose, glucose, and maltotriose. Of these, the maltose content is predominant. Selecting the yeast type is sometimes a bit tricky, but most important is that it should be able to catalyze the fermentation reactions at the chosen process temperature. The type studied in this example thrives at temperatures near 12°C, which is ideal for brewing lager.
Reaction Kinetics
The irreversible reactions taking place during the fermentation process can be written in the following simplified form:
(1)
(2)
(3)
where G, M, and N denote glucose, maltose, and maltotriose, respectively. Furthermore, E stands for ethanol and CO2 for the carbon dioxide dissolved in the wort. The X notation shows the presence of yeast. Aside from carbon dioxide and ethanol, different flavoring components are formed. This tutorial accounts for two types of flavors: Ethyl acetate (EtAc) and acetaldehyde (AcA). The former, an ester, gives a desirable taste, the latter, an aldehyde, gives a bad tasting beer.
The reaction kinetics are as follows (for reactions 1, 2, and 3). Note that as a consequence of the simplified reaction description, yield coefficients, Y, are used to compute product concentrations:
The fermentation mechanisms depend on the yeast concentration and the reaction rate constant, ki (SI unit: s1), can be described using Michaelis–Menten kinetics:
The last two reactions are also inhibited by high sugar concentrations:
kG, kM, and kN are the maximum velocities (SI unit: s1), K the Michaelis–Menten constant, and K' an inhibition constant for the fermentation reaction. These three properties are temperature dependent as defined by the Arrhenius equation:
Here, A is the frequency factor and E is the activation energy.
The yeast concentration is modeled as a free species, with the following reaction rate:
where kx is the reaction rate constant that depends on the reaction constant of the three governing reactions and the fact that a high yeast concentration inhibits its production:
where KX is the yeast growth inhibition constant and cx0 the initial yeast concentration in the tank.
The alcohol production needs to be corrected with yield coefficients as well, giving the following total reaction rate:
In similar manner, the production of the ethyl acetate flavor compound can be written as:
The acetaldehyde flavor, on the other hand, also decomposes, as given by:
where kAcA is the rate constant for the decomposition of acetaldehyde and is defined with the Arrhenius equation.
Both the gaseous and dissolved carbon dioxide are computed in the example. The reaction rate of the gaseous species is described by:
where KGL is the gas to liquid mass transfer coefficient of carbon dioxide and cCO2(sat) the maximum solubility concentration of carbon dioxide in water.
For the dissolved species, the reaction rate becomes:
The reaction data required to simulated the fermentation reactions are tabulated in Table 1.
EG
9.46·104 J/mol
AHG
1.36·1010 mol/m3
EM
4.73·104 J/mol
AHM
1.42·1024 mol/m3
EN
3.00·104 J/mol
AAcA
9.13 m3/(s·mol)
EHG
-2.87·105 J/mol
YX1
EHM
-6.03·104 J/mol
YX2
EHN
-8.33·104 J/mol
E'HG
4.27·104 J/mol
YE1
E'HM
1.10·105 J/mol
YE2
EAcA
4.64·104 J/mol
YE3
AG
9.51·1011 1/s
YEtAc
AM
YAcA
AN
KX
3.65·105 mol2/m6
AHG
2.09·10-53 mol/m3
KGL
1.94·10-5 1/s
AHM
3.40·10-9 mol/m3
cCO2(sat)
3.90·102 mol/m3
AHN
2.34·10-12 mol/m3
The perfectly mixed model is solved with the Reaction Engineering interface using the Batch, constant volume, reactor type at nonisothermal conditions.
For the three reactions, reactions heats are available: ΔH1 = −91.2 kJ/mol, ΔH2 = −226.3 kJ/mol, and ΔH2 = −361.3 kJ/mol, that are entered into the energy balance settings in the interface. The wort mixture is assumed to have similar thermal properties as water, that is, water is included as solvent. A cooling medium, with a temperature, ΔTC, lower than the initial tank temperature, cools the fermentation process with the rate, qv (SI unit: W/(m3·K)):
where Qext is the total heat removed from the reactor (SI unit: W).
Beer fermentation usually takes place in spheroconical tanks (Figure 1). Such a design is suitable for easy separation of yeast from the liquid either at the top or the bottom, and it enables better temperature control. Modern beer brewing equipment often has a built-in cooling jacket, but sometimes the tank is just situated in a cooled environment.
Figure 1: Spheroconical tank for fermentation.
The space-dependent model is created using the Generate Space-Dependent Model feature. The kinetics are thus the same as in the perfectly mixed model. Due to rotational symmetry, you can model the whole system in 2D, using an axisymmetric geometry. The mass transport is modeled using the Transport of Diluted Species interface, the fluid motion with the Laminar Flow interface, and the heat transport using the Heat Transfer in Fluids interface. The wort takes up the part of the reactor as indicated in Figure 1.
The cooling is incorporated as a convective heat flux boundary condition driven by the temperature difference between the tank and the cooling media, as described by:
where h is an automatically defined heat transfer coefficient for external natural convection.
The only source of mixing is by natural convection, which is achieved by the coupling all three interfaces. As an assumption, the only property affecting the density of the mixture is the temperature. Also, the Boussinesq approximation is used, meaning that in the single-phase flow interface, the density is only varied in the volume force term.
Results and Discussion
The results from the perfectly mixed model are shown in Figure 2. The temperature in the cooling media and the initial tank temperature are both set to 12°C. The cooling rate is 8 W/(m3·K).
Figure 2: Plots displaying the results of the perfectly mixed model.
At these conditions, all three sugars decrease with time and the alcohol content reaches more than 5 vol%. Unfortunately, this beer will contain a considerable amount of aldehydes and probably taste bad. After reaching a maximum, the aldehyde concentration decreases and it is therefore important to continue the fermentation process long enough to allow the concentration to decrease to acceptable levels. A higher initial yeast concentration is one approach to decrease the aldehyde content more quickly. The temperature increase observed initially coincides with the quick consumption of glucose. After 60 h, all glucose has been consumed.
The results from the space-dependent model show a very even distribution in concentrations within the tank. In Figure 3, this is illustrated with the concentration of the undesired aldehyde after 3 hours. The same even concentration is seen throughout the whole simulation (24 h)
Figure 3: Concentration (mol/m3) of acetaldehyde after 3 hours.
The well mixed behavior is also seen in Figure 4, showing the velocity magnitude, the temperature difference T − T0, as well as the total energy flux (indicated by arrows), all at 3 h of fermenting. The velocity magnitude illustrates how natural convection creates a downward flow along the cold tank surface. In the temperature plot, the temperature difference is clearly seen along the fluid interface.
Figure 4: Velocity magnitude, temperature difference T − T0, as well as the total energy flux (indicated by arrows). 3 h of fermentation.
Figure 5 shows the temperature in the top and at the bottom of the tank. During the simulated time frame the temperature is only increased a few degrees from the starting condition. Comparing the temperature reached at 24 h in the 0D model (Figure 2e) with that in the space-dependent model (Figure 5), we see that the values are practically the same.
Figure 5: Temperature of the wort as a function of fermentation time. Temperatures at the top and in the bottom of the tank.
References
1. D.A. Gee and W.F. Ramirez, “A Flavour Model for Beer Fermentation,” J. Inst. Brew., vol. 100, pp. 321–329, 1994.
2. W.F. Ramirez and J. Maciejowski, “Optimal Beer Fermentation,” J. Inst. Brew., vol. 113, no. 3, pp. 325–333, 2007.
Application Library path: Chemical_Reaction_Engineering_Module/Reactors_with_Mass_and_Heat_Transfer/beer_fermentation
Modeling Instructions
Setting up 0D (perfectly mixed) model using the Reaction Engineering interface.
From the File menu, choose New.
New
In the New window, click  Model Wizard.
Model Wizard
1
In the Model Wizard window, click  0D.
2
In the Select Physics tree, select Chemical Species Transport>Reaction Engineering (re).
3
Click Add.
4
Click  Study.
5
In the Select Study tree, select General Studies>Time Dependent.
6
Reaction Engineering (re)
Load model parameters and variables from text files.
Global Definitions
Parameters 1
1
In the Model Builder window, under Global Definitions click Parameters 1.
2
In the Settings window for Parameters, locate the Parameters section.
3
Click  Load from File.
4
Definitions
Variables 1
1
In the Model Builder window, under Component 1 (comp1) right-click Definitions and choose Variables.
2
In the Settings window for Variables, locate the Variables section.
3
Click  Load from File.
4
Reaction Engineering (re)
Use the Batch, constant volume, reactor type (the default) and model nonisothermal conditions by including the Energy Balance.
1
In the Model Builder window, under Component 1 (comp1) click Reaction Engineering (re).
2
In the Settings window for Reaction Engineering, locate the Energy Balance section.
3
4
In the Qext text field, type -qv*(re.T-(T0-(dTc-273.15[K])))*re.Vr.
5
Locate the Mixture Properties section. From the Phase list, choose Liquid.
Continue by entering free species, reactions, and a solvent.
Species 1
1
In the Reaction Engineering toolbar, click  Species.
2
In the Settings window for Species, locate the Name section.
3
Most reaction products do not fully follow the reaction stoichiometry, therefore enter, where necessary, user defined reaction rates in their respective species nodes.
4
Click to expand the Reaction Rate section. From the list, choose User defined.
5
In the Ri text field, type (YXG*kf1+YXM*kf2+YXN*kf3)*re.c_X*KX/(KX+(re.c_X-c0X)^2).
Reaction 1
1
In the Reaction Engineering toolbar, click  Reaction.
2
In the Settings window for Reaction, locate the Reaction Formula section.
3
In the Formula text field, type G=>E+CO2+EtAc+AcA.
4
Locate the Reaction Rate section. From the list, choose User defined.
5
In the rj text field, type kf1*re.c_X.
6
Locate the Reaction Thermodynamic Properties section. From the Enthalpy of reaction list, choose User defined.
7
In the H text field, type HG.
Continue to enter user defined reaction rates in the respective species nodes where necessary.
Species: E
1
In the Model Builder window, click Species: E.
2
In the Settings window for Species, locate the Chemical Formula section.
3
Select the Enable formula check box.
4
5
Locate the Reaction Rate section. From the list, choose User defined.
6
In the Ri text field, type (YEG*kf1+YEM*kf2+YEN*kf3)*re.c_X.
Species: CO2
1
In the Model Builder window, click Species: CO2.
2
In the Settings window for Species, locate the Reaction Rate section.
3
4
In the Ri text field, type max(hCO2*(Csat_CO2-re.c_CO2),0).
Species: EtAc
1
In the Model Builder window, click Species: EtAc.
2
In the Settings window for Species, locate the Chemical Formula section.
3
Select the Enable formula check box.
4
5
Locate the Reaction Rate section. From the list, choose User defined.
6
In the Ri text field, type YEtAc*(kf1+kf2+kf3)*re.c_X.
Species: AcA
1
In the Model Builder window, click Species: AcA.
2
In the Settings window for Species, locate the Chemical Formula section.
3
Select the Enable formula check box.
4
5
Locate the Reaction Rate section. From the list, choose User defined.
6
In the Ri text field, type YAcA*(kf1+kf2+kf3)*re.c_X-kAcA*re.c_AcA*re.c_X.
Reaction 2
1
In the Reaction Engineering toolbar, click  Reaction.
2
In the Settings window for Reaction, locate the Reaction Formula section.
3
In the Formula text field, type M=>E+CO2+EtAc+AcA.
4
Click Apply.
5
Locate the Reaction Rate section. From the list, choose User defined.
6
In the rj text field, type kf2*re.c_X.
7
Locate the Reaction Thermodynamic Properties section. From the Enthalpy of reaction list, choose User defined.
8
In the H text field, type HM.
Reaction 3
1
In the Reaction Engineering toolbar, click  Reaction.
2
In the Settings window for Reaction, locate the Reaction Formula section.
3
In the Formula text field, type N=>E+CO2+EtAc+AcA.
4
Click Apply.
5
Locate the Reaction Rate section. From the list, choose User defined.
6
In the rj text field, type kf3*re.c_X.
7
Locate the Reaction Thermodynamic Properties section. From the Enthalpy of reaction list, choose User defined.
8
In the H text field, type HN.
Species 1
In the Reaction Engineering toolbar, click  Species.
Species: N
1
In the Model Builder window, click Species: N.
2
In the Settings window for Species, locate the Chemical Formula section.
3
Clear the Enable formula check box.
Species 1
1
In the Model Builder window, under Component 1 (comp1)>Reaction Engineering (re) click Species 1.
2
In the Settings window for Species, locate the Name section.
3
4
Locate the Type section. From the list, choose Solvent.
5
Click to expand the Thermodynamic Expressions section. From the list, choose User defined.
6
In the Cp text field, type CpH2O.
7
In the Reaction Engineering toolbar, click  Species.
Species 1
1
In the Settings window for Species, locate the Name section.
2
3
Locate the Reaction Rate section. From the list, choose User defined.
4
In the Ri text field, type (YXG*kf1+YXM*kf2+YXN*kf3)*re.c_X-max(hCO2*(Csat_CO2-re.c_CO2),0).
Initial Values 1
1
In the Model Builder window, click Initial Values 1.
2
In the Settings window for Initial Values, locate the General Parameters section.
3
In the T0 text field, type T0.
4
Locate the Volumetric Species Initial Values section. In the table, enter the following settings:
Solve the model for 400 h.
Study 1
Step 1: Time Dependent
1
In the Model Builder window, under Study 1 click Step 1: Time Dependent.
2
In the Settings window for Time Dependent, locate the Study Settings section.
3
From the Time unit list, choose h.
4
In the Output times text field, type range(0,1,400).
5
From the Tolerance list, choose User controlled.
6
In the Relative tolerance text field, type 1e-6.
Solution 1 (sol1)
1
In the Study toolbar, click  Show Default Solver.
2
In the Model Builder window, expand the Solution 1 (sol1) node, then click Time-Dependent Solver 1.
3
In the Settings window for Time-Dependent Solver, click to expand the Absolute Tolerance section.
4
From the Tolerance method list, choose Manual.
5
In the Absolute tolerance text field, type 1.0E-7.
6
Click  Compute.
Results
Sugars
First, create 2a in Figure 2.
1
In the Settings window for 1D Plot Group, type Sugars in the Label text field.
Global 1
1
In the Model Builder window, expand the Sugars node, then click Global 1.
2
In the Settings window for Global, click Replace Expression in the upper-right corner of the y-Axis Data section. From the menu, choose Component 1 (comp1)>Reaction Engineering>re.c_G - Concentration - mol/m³.
3
Click Add Expression in the upper-right corner of the y-Axis Data section. From the menu, choose Component 1 (comp1)>Reaction Engineering>re.c_M - Concentration - mol/m³.
4
Click Add Expression in the upper-right corner of the y-Axis Data section. From the menu, choose Component 1 (comp1)>Reaction Engineering>re.c_N - Concentration - mol/m³.
5
Click to expand the Title section. From the Title type list, choose Manual.
6
In the Title text area, type Sugar Concentrations.
7
Click to expand the Coloring and Style section. From the Width list, choose 2.
8
Click to expand the Legends section. From the Legends list, choose Manual.
9
10
In the Sugars toolbar, click  Plot.
Continue with 2b in Figure 2.
Alcohol
1
In the Model Builder window, right-click Sugars and choose Duplicate.
2
In the Settings window for 1D Plot Group, type Alcohol in the Label text field.
3
Locate the Plot Settings section.
4
Select the y-axis label check box. In the associated text field, type vol% alcohol.
Global 1
1
In the Model Builder window, expand the Alcohol node, then click Global 1.
2
In the Settings window for Global, click Replace Expression in the upper-right corner of the y-Axis Data section. From the menu, choose Component 1 (comp1)>Definitions>Variables>Evol - vol% alcohol.
3
Locate the Title section. In the Title text area, type Alcohol Content.
4
Locate the Legends section. Clear the Show legends check box.
5
In the Alcohol toolbar, click  Plot.
The yeast concentration plot (2c in Figure 2) is set up following these steps:
Yeast
1
In the Model Builder window, right-click Alcohol and choose Duplicate.
2
In the Settings window for 1D Plot Group, type Yeast in the Label text field.
3
Locate the Plot Settings section. In the y-axis label text field, type Concentration (mol/m<sup>3</sup>).
Global 1
1
In the Model Builder window, expand the Yeast node, then click Global 1.
2
In the Settings window for Global, click Replace Expression in the upper-right corner of the y-Axis Data section. From the menu, choose Component 1 (comp1)>Reaction Engineering>re.c_X - Concentration - mol/m³.
3
Locate the Title section. In the Title text area, type Yeast Concentration.
4
In the Yeast toolbar, click  Plot.
The flavors plot (2d) in Figure 2 is set up following these steps:
Flavors
1
In the Model Builder window, right-click Sugars and choose Duplicate.
2
In the Settings window for 1D Plot Group, type Flavors in the Label text field.
Global 1
1
In the Model Builder window, expand the Flavors node, then click Global 1.
2
In the Settings window for Global, click Replace Expression in the upper-right corner of the y-Axis Data section. From the menu, choose Component 1 (comp1)>Reaction Engineering>re.c_EtAc - Concentration - mol/m³.
3
Click Add Expression in the upper-right corner of the y-Axis Data section. From the menu, choose Component 1 (comp1)>Reaction Engineering>re.c_AcA - Concentration - mol/m³.
4
Locate the Title section. In the Title text area, type Flavor Concentrations.
5
Locate the Legends section. In the table, enter the following settings:
6
In the Flavors toolbar, click  Plot.
Last, create the temperature plot 2e in Figure 2.
Temperature (re)
1
In the Model Builder window, under Results click Temperature (re).
2
In the Settings window for 1D Plot Group, locate the Plot Settings section.
3
Select the y-axis label check box. In the associated text field, type Temperature (<sup>o</sup>C).
Global 1
1
In the Model Builder window, expand the Temperature (re) node, then click Global 1.
2
In the Settings window for Global, locate the y-Axis Data section.
3
4
Locate the Title section. From the Title type list, choose Manual.
5
In the Title text area, type Temperature.
6
Locate the Coloring and Style section. From the Width list, choose 2.
7
Locate the Legends section. Clear the Show legends check box.
8
In the Temperature (re) toolbar, click  Plot.
Now, create the space dependent model using the 0D model as a starting point. The Generate Space-Dependent Model feature makes this process straightforward.
Reaction Engineering (re)
Generate Space-Dependent Model 1
1
In the Reaction Engineering toolbar, click  Generate Space-Dependent Model.
2
In the Settings window for Generate Space-Dependent Model, locate the Component Settings section.
3
From the Component to use list, choose 2Daxi: New.
4
Locate the Physics Interfaces section. Find the Fluid flow subsection. From the list, choose Laminar Flow: New.
5
Find the Heat transfer subsection. From the list, choose Heat Transfer in Fluids: New.
6
Locate the Study Type section. From the Study type list, choose Time dependent.
7
Locate the Space-Dependent Model Generation section. Click Create/Refresh.
Multiphysics
In the Model Builder window, expand the Component 2 (comp2) node, then click Multiphysics.
Nonisothermal Flow 1 (nitf1)
In the Physics toolbar, click  Multiphysics Couplings and choose Domain>Nonisothermal Flow.
In the previous step it was seen that the temperature varied in a range of 10 degrees. In this range the density variations are small, and the fluid can be treated as incompressible. To still account for free convection, due to temperature variations, use the Boussinesq approximation.
Laminar Flow 1 (spf)
1
In the Model Builder window, under Component 2 (comp2) click Laminar Flow 1 (spf).
2
In the Settings window for Laminar Flow, locate the Physical Model section.
3
From the Compressibility list, choose Incompressible flow.
Multiphysics
Nonisothermal Flow 1 (nitf1)
1
In the Model Builder window, under Component 2 (comp2)>Multiphysics click Nonisothermal Flow 1 (nitf1).
2
In the Settings window for Nonisothermal Flow, locate the Material Properties section.
3
Select the Boussinesq approximation check box.
Reacting Flow, Diluted Species 1 (rfd1)
In the Physics toolbar, click  Multiphysics Couplings and choose Domain>Reacting Flow, Diluted Species.
Import the mesh from a file. The tank geometry is imported together with the mesh.
Mesh 1
Import 1
1
In the Mesh toolbar, click  Import.
2
In the Settings window for Import, locate the Import section.
3
In the Filename text field, type beer_fermentation_mesh.mphbin.
4
Click  Import.
The imported geometry contains a number of selections. These are listed in the Domain Selections and Boundary Selections sections in the settings window.
Add materials to the geometry.
Add Material
1
In the Home toolbar, click  Add Material to open the Add Material window.
2
Go to the Add Material window.
3
4
Click Add to Component in the window toolbar.
5
In the tree, select Built-in>Water, liquid.
6
Click Add to Component in the window toolbar.
Materials
Water, liquid (mat2)
1
In the Settings window for Material, locate the Geometric Entity Selection section.
2
From the Selection list, choose Wort.
Add Material
1
Go to the Add Material window.
2
In the tree, select Built-in>Copper.
3
Click Add to Component in the window toolbar.
4
In the Home toolbar, click  Add Material to close the Add Material window.
Materials
Copper (mat3)
1
In the Settings window for Material, locate the Geometric Entity Selection section.
2
From the Selection list, choose Tank.
Add variables for the space-dependent model.
Definitions (comp2)
Variables 2
1
In the Model Builder window, under Component 2 (comp2) right-click Definitions and choose Variables.
2
In the Settings window for Variables, locate the Variables section.
3
Click  Load from File.
4
Hide all the interior boundaries (used for meshing purposes) except the one that correspond to the vapor liquid interface.
Hide for Physics 1
1
In the Model Builder window, right-click View 1 and choose Hide for Physics.
2
In the Settings window for Hide for Physics, locate the Geometric Entity Selection section.
3
From the Geometric entity level list, choose Boundary.
4
Chemistry 1 (chem)
In this model, the transport properties used will be those defined from materials. The transport properties computed by the Chemistry interface can thus be disabled.
1
In the Model Builder window, under Component 2 (comp2) click Chemistry 1 (chem).
2
In the Settings window for Chemistry, click to expand the Calculate Transport Properties section.
3
Clear the Calculate mixture properties check box.
The molar masses are automatically computed for species whose names consists of chemical elements from the periodic table. This is also done for species with arbitrary names where the chemical composition has been defined in the Chemical Formula section. Add the molar masses for maltose, maltotriose, glucose, and yeast enzymes, for which the composition has not been given.
Species: G
1
In the Model Builder window, expand the Chemistry 1 (chem) node, then click Species: G.
2
In the Settings window for Species, locate the Chemical Formula section.
3
In the M text field, type MG.
Species: M
1
In the Model Builder window, click Species: M.
2
In the Settings window for Species, locate the Chemical Formula section.
3
In the M text field, type MM.
Species: N
1
In the Model Builder window, click Species: N.
2
In the Settings window for Species, locate the Chemical Formula section.
3
In the M text field, type MN.
Species: X
1
In the Model Builder window, click Species: X.
2
In the Settings window for Species, locate the Chemical Formula section.
3
In the M text field, type MX.
In the next stage of the modeling process you will set up the physics interfaces describing the mass transport, heat transfer, and fluid flow.
Transport of Diluted Species (tds)
1
In the Model Builder window, under Component 2 (comp2) click Transport of Diluted Species (tds).
2
In the Settings window for Transport of Diluted Species, locate the Domain Selection section.
3
From the Selection list, choose Wort.
Heat Transfer in Fluids 1 (ht)
1
In the Model Builder window, expand the Transport of Diluted Species (tds) node, then click Component 2 (comp2)>Heat Transfer in Fluids 1 (ht).
2
In the Settings window for Heat Transfer in Fluids, locate the Physical Model section.
3
In the Tref text field, type T0.
Heat Source 1
1
In the Model Builder window, under Component 2 (comp2)>Heat Transfer in Fluids 1 (ht) click Heat Source 1.
2
In the Settings window for Heat Source, locate the Domain Selection section.
3
From the Selection list, choose Wort.
Solid 1
1
In the Physics toolbar, click  Domains and choose Solid.
2
In the Settings window for Solid, locate the Domain Selection section.
3
From the Selection list, choose Tank.
Fluid 2
1
In the Physics toolbar, click  Domains and choose Fluid.
2
In the Settings window for Fluid, locate the Domain Selection section.
3
From the Selection list, choose Empty tank section.
4
Locate the Model Input section. Click Make All Model Inputs Editable in the upper-right corner of the section.
5
From the T list, choose Temperature (ht).
6
From the pA list, choose User defined.
Heat Flux 1
1
In the Physics toolbar, click  Boundaries and choose Heat Flux.
2
3
In the Settings window for Heat Flux, locate the Heat Flux section.
4
From the Flux type list, choose Convective heat flux.
5
From the Heat transfer coefficient list, choose External natural convection.
6
In the L text field, type 3.
7
In the Text text field, type T0.
Laminar Flow 1 (spf)
1
In the Model Builder window, under Component 2 (comp2) click Laminar Flow 1 (spf).
2
In the Settings window for Laminar Flow, locate the Domain Selection section.
3
From the Selection list, choose Wort.
4
Locate the Physical Model section. Select the Include gravity check box.
Initial Values 1
1
In the Model Builder window, expand the Laminar Flow 1 (spf) node, then click Initial Values 1.
2
In the Settings window for Initial Values, locate the Initial Values section.
3
In the p text field, type spf.rhoref*g_const*(3-z).
Pressure Point Constraint 1
1
In the Physics toolbar, click  Points and choose Pressure Point Constraint.
2
Symmetry 1
1
In the Physics toolbar, click  Boundaries and choose Symmetry.
2
Study 2
First generate a default solver for fluid and heat transfer only. This produces a default solver setting for natural convection problems, due to the presence of gravity.
Step 1: Time Dependent
1
In the Model Builder window, expand the Study 2 node, then click Step 1: Time Dependent.
2
In the Settings window for Time Dependent, locate the Study Settings section.
3
From the Time unit list, choose h.
4
In the Output times text field, type range(0,0.1,4) range(5,1,24).
5
Locate the Physics and Variables Selection section. In the table, clear the Solve for check boxes for Chemistry 1 (chem) and Transport of Diluted Species (tds).
Solution 2 (sol2)
1
In the Study toolbar, click  Show Default Solver.
Now choose to include the mass transport as well.
Step 1: Time Dependent
1
In the Model Builder window, under Study 2 click Step 1: Time Dependent.
2
In the Settings window for Time Dependent, locate the Physics and Variables Selection section.
3
In the table, select the Solve for check boxes for Chemistry 1 (chem) and Transport of Diluted Species (tds).
Solution 2 (sol2)
1
In the Model Builder window, expand the Study 2>Solver Configurations>Solution 2 (sol2)>Dependent Variables 1 node, then click Concentration (comp2.cAcA).
2
In the Settings window for Field, locate the Scaling section.
3
From the Method list, choose Manual.
4
In the Model Builder window, under Study 2>Solver Configurations>Solution 2 (sol2)>Dependent Variables 1 click Concentration (comp2.cEtAc).
5
In the Settings window for Field, locate the Scaling section.
6
From the Method list, choose Manual.
7
In the Model Builder window, under Study 2>Solver Configurations>Solution 2 (sol2)>Dependent Variables 1 click Concentration (comp2.cM).
8
In the Settings window for Field, locate the Scaling section.
9
From the Method list, choose Initial value based.
10
In the Model Builder window, under Study 2>Solver Configurations>Solution 2 (sol2)>Dependent Variables 1 click Concentration (comp2.cN).
11
In the Settings window for Field, locate the Scaling section.
12
From the Method list, choose Initial value based.
13
In the Model Builder window, under Study 2>Solver Configurations>Solution 2 (sol2)>Dependent Variables 1 click Concentration (comp2.cX).
14
In the Settings window for Field, locate the Scaling section.
15
From the Method list, choose Initial value based.
16
In the Model Builder window, under Study 2>Solver Configurations>Solution 2 (sol2)>Dependent Variables 1 click Pressure (comp2.p).
17
In the Settings window for Field, locate the Scaling section.
18
From the Method list, choose Initial value based.
19
In the Model Builder window, under Study 2>Solver Configurations>Solution 2 (sol2)>Dependent Variables 1 click Temperature (comp2.T).
20
In the Settings window for Field, locate the Scaling section.
21
From the Method list, choose Initial value based.
Natural convection is present in the wort due to the heat release from the reaction, and the cooling along the tank wall. Restrict the solver from taking too large time steps during the initial phase.
22
In the Model Builder window, under Study 2>Solver Configurations>Solution 2 (sol2) click Time-Dependent Solver 1.
23
In the Settings window for Time-Dependent Solver, click to expand the Time Stepping section.
24
Select the Initial step check box. In the associated text field, type 1/3600.
25
From the Maximum step constraint list, choose Expression.
26
In the Maximum step text field, type (60)*(t<4*3600)+(300)*(t>4*3600).
Use Get initial condition to initialize the datasets and to produce default plot groups. Continue by editing the plot groups before computing the solution.
27
In the Study toolbar, click  Get Initial Value.
Begin by creating the datasets to be used in the plot groups.
Results
Study 2/Wort
1
In the Model Builder window, expand the Results>Datasets node.
2
Right-click Results>Datasets>Study 2/Solution 2 (sol2) and choose Duplicate.
3
In the Settings window for Solution, type Study 2/Wort in the Label text field.
Selection
1
In the Results toolbar, click  Attributes and choose Selection.
2
In the Settings window for Selection, locate the Geometric Entity Selection section.
3
From the Geometric entity level list, choose Domain.
4
From the Selection list, choose Wort.
Revolution 2D - Wort
1
In the Model Builder window, under Results>Datasets right-click Revolution 2D 1 and choose Duplicate.
2
In the Settings window for Revolution 2D, type Revolution 2D - Wort in the Label text field.
3
Locate the Data section. From the Dataset list, choose Study 2/Wort (sol2).
Revolution 2D - Wort, Study 2/Wort (sol2)
1
In the Model Builder window, under Results>Datasets, Ctrl-click to select Study 2/Wort (sol2) and Revolution 2D - Wort.
2
Study 2/Tank
In the Settings window for Solution, type Study 2/Tank in the Label text field.
Selection
1
In the Model Builder window, expand the Results>Datasets>Study 2/Tank (sol2) node, then click Selection.
2
In the Settings window for Selection, locate the Geometric Entity Selection section.
3
From the Selection list, choose Tank.
Revolution 2D - Tank
1
In the Model Builder window, under Results>Datasets click Revolution 2D - Wort 1.
2
In the Settings window for Revolution 2D, type Revolution 2D - Tank in the Label text field.
3
Locate the Data section. From the Dataset list, choose Study 2/Tank (sol2).
Cut Plane 1
1
In the Results toolbar, click  Cut Plane.
2
In the Settings window for Cut Plane, locate the Data section.
3
From the Dataset list, choose Revolution 2D - Wort.
4
Locate the Plane Data section. From the Plane type list, choose General.
5
In row Point 2, set x to 0.
6
In row Point 2, set z to 1.
7
In row Point 3, set x to cos(-90[deg]).
8
In row Point 3, set y to sin(-90[deg]).
Cut Plane 2
1
Right-click Cut Plane 1 and choose Duplicate.
2
In the Settings window for Cut Plane, locate the Plane Data section.
3
In row Point 3, set x to cos(135[deg]).
4
In row Point 3, set y to sin(135[deg]).
Now edit the plot groups.
Velocity Field and Temperature
1
In the Model Builder window, under Results click Concentration, AcA (tds).
2
In the Settings window for 2D Plot Group, type Velocity Field and Temperature in the Label text field.
3
Click to expand the Title section. From the Title type list, choose None.
4
Locate the Color Legend section. Select the Show units check box.
5
Click to expand the Plot Array section. Select the Enable check box.
6
In the Relative padding text field, type 0.5.
7
In the Velocity Field and Temperature toolbar, click  Plot.
Surface 1
1
In the Model Builder window, expand the Velocity Field and Temperature node, then click Surface 1.
2
In the Settings window for Surface, locate the Expression section.
3
In the Expression text field, type spf.U.
4
Locate the Coloring and Style section. From the Coloring list, choose Gradient.
5
From the Top color list, choose Custom.
6
Click Define custom colors.
7
8
Click Add to custom colors.
9
Click Show color palette only or OK on the cross-platform desktop.
10
From the Bottom color list, choose Custom.
11
Click Define custom colors.
12
13
Click Add to custom colors.
14
Click Show color palette only or OK on the cross-platform desktop.
Surface 2
1
Right-click Results>Velocity Field and Temperature>Surface 1 and choose Duplicate.
2
In the Settings window for Surface, locate the Expression section.
3
In the Expression text field, type T-T0.
4
Locate the Coloring and Style section. From the Coloring list, choose Color table.
Streamline 1
In the Model Builder window, under Results>Velocity Field and Temperature right-click Streamline 1 and choose Delete.
Arrow Surface 1
1
In the Model Builder window, right-click Velocity Field and Temperature and choose Arrow Surface.
2
In the Settings window for Arrow Surface, locate the Expression section.
3
In the r-component text field, type ht.tefluxr.
4
In the z-component text field, type ht.tefluxz.
5
Locate the Arrow Positioning section. Find the r grid points subsection. In the Points text field, type 10.
6
Locate the Coloring and Style section. From the Arrow type list, choose Cone.
7
From the Arrow length list, choose Logarithmic.
8
In the Range quotient text field, type 1000.
9
From the Color list, choose Black.
10
Click to expand the Plot Array section. Select the Manual indexing check box.
11
In the Index text field, type 1.
12
In the Velocity Field and Temperature toolbar, click  Plot.
Concentration, AcA, 3D (tds)
1
In the Model Builder window, expand the Results>Concentration, AcA, 3D (tds) node, then click Concentration, AcA, 3D (tds).
2
In the Settings window for 3D Plot Group, locate the Plot Settings section.
3
Clear the Plot dataset edges check box.
Surface 2
1
In the Model Builder window, under Results>Concentration, AcA, 3D (tds) right-click Surface 1 and choose Duplicate.
2
In the Settings window for Surface, locate the Data section.
3
From the Dataset list, choose Revolution 2D - Tank.
4
Locate the Expression section. In the Expression text field, type 1.
5
Locate the Coloring and Style section. From the Coloring list, choose Uniform.
6
From the Color list, choose Gray.
Concentration, AcA (Acetaldehyde)
1
In the Model Builder window, under Results click Concentration, AcA, 3D (tds).
2
In the Settings window for 3D Plot Group, type Concentration, AcA (Acetaldehyde) in the Label text field.
Temperature, 3D (ht1)
1
In the Model Builder window, click Temperature, 3D (ht1).
2
In the Settings window for 3D Plot Group, locate the Plot Settings section.
3
Clear the Plot dataset edges check box.
Surface
1
In the Model Builder window, expand the Temperature, 3D (ht1) node, then click Surface.
2
In the Settings window for Surface, locate the Data section.
3
From the Dataset list, choose Revolution 2D - Wort.
Surface 2
1
Right-click Surface and choose Duplicate.
2
In the Settings window for Surface, locate the Data section.
3
From the Dataset list, choose Revolution 2D - Tank.
4
Locate the Expression section. In the Expression text field, type 1.
5
Locate the Coloring and Style section. From the Coloring list, choose Uniform.
6
From the Color list, choose Gray.
Arrow Surface 1
1
In the Model Builder window, right-click Temperature, 3D (ht1) and choose Arrow Surface.
2
In the Settings window for Arrow Surface, locate the Data section.
3
From the Dataset list, choose Cut Plane 1.
4
Click Replace Expression in the upper-right corner of the Expression section. From the menu, choose Component 2 (comp2)>Heat Transfer in Fluids 1>Domain fluxes>ht.tefluxr,...,ht.tefluxz - Total energy flux.
5
Locate the Coloring and Style section. From the Arrow type list, choose Cone.
6
From the Color list, choose Black.
Arrow Surface 2
1
Right-click Arrow Surface 1 and choose Duplicate.
2
In the Settings window for Arrow Surface, locate the Data section.
3
From the Dataset list, choose Cut Plane 2.
Temperature, 3D
1
In the Model Builder window, under Results click Temperature, 3D (ht1).
2
In the Settings window for 3D Plot Group, type Temperature, 3D in the Label text field.
Delete the default plot groups that are not needed, namely all concentration plots for CO2, E, EtAc, G, M, N and X (in total 16), plus the two Velocity plots. Easiest way to delete them is to Ctrl-click to select all of them and then right-click and choose Delete.
Temperature, Top and Bottom
1
In the Home toolbar, click  Add Plot Group and choose 1D Plot Group.
2
In the Settings window for 1D Plot Group, type Temperature, Top and Bottom in the Label text field.
Point Graph 1
1
Right-click Temperature, Top and Bottom and choose Point Graph.
2
Temperature, Top and Bottom
1
In the Model Builder window, click Temperature, Top and Bottom.
2
In the Settings window for 1D Plot Group, locate the Data section.
3
From the Dataset list, choose Study 2/Solution 2 (sol2).
Point Graph 1
1
In the Model Builder window, click Point Graph 1.
2
In the Settings window for Point Graph, locate the Selection section.
3
Click to select the  Activate Selection toggle button.
4
5
Locate the y-Axis Data section. In the Expression text field, type T.
6
From the Unit list, choose degC.
7
Click to expand the Legends section. Select the Show legends check box.
8
Find the Include subsection. Select the Expression check box.
9
Clear the Point check box.
10
Find the Prefix and suffix subsection. In the Suffix text field, type , Top.
Point Graph 2
1
Right-click Results>Temperature, Top and Bottom>Point Graph 1 and choose Duplicate.
2
In the Settings window for Point Graph, locate the Selection section.
3
Click to select the  Activate Selection toggle button.
4
Click  Clear Selection.
5
Click the  Zoom Extents button in the Graphics toolbar.
6
7
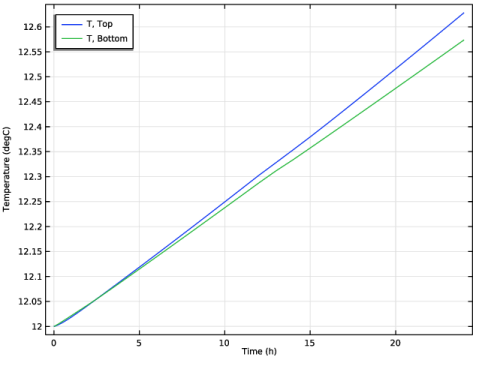
Locate the Legends section. Find the Prefix and suffix subsection. In the Suffix text field, type , Bottom.
8
In the Temperature, Top and Bottom toolbar, click  Plot.
With all the plot groups ready, compute the study and choose the setting to update the plots with results while solving.
Study 2
Step 1: Time Dependent
1
In the Model Builder window, under Study 2 click Step 1: Time Dependent.
2
In the Settings window for Time Dependent, click to expand the Results While Solving section.
3
Select the Plot check box.
4
From the Plot group list, choose Velocity Field and Temperature.
5
From the Update at list, choose Time steps taken by solver.
6
In the Home toolbar, click  Compute.
Results
Velocity Field and Temperature
Time to look at the results.
1
In the Settings window for 2D Plot Group, locate the Data section.
2
From the Time (h) list, choose 3.
3
In the Velocity Field and Temperature toolbar, click  Plot.
Concentration, AcA (Acetaldehyde)
1
In the Model Builder window, click Concentration, AcA (Acetaldehyde).
2
In the Settings window for 3D Plot Group, locate the Data section.
3
From the Time (h) list, choose 3.
4
In the Concentration, AcA (Acetaldehyde) toolbar, click  Plot.
Temperature, 3D
1
In the Model Builder window, click Temperature, 3D.
2
In the Settings window for 3D Plot Group, locate the Data section.
3
From the Time (h) list, choose 3.
4
In the Temperature, 3D toolbar, click  Plot.
Surface
1
In the Model Builder window, click Surface.
2
In the Settings window for Surface, locate the Data section.
3
From the Solution parameters list, choose From parent.
Surface 2
1
In the Model Builder window, click Surface 2.
2
In the Settings window for Surface, locate the Data section.
3
From the Solution parameters list, choose From parent.
Arrow Surface 1
1
In the Model Builder window, click Arrow Surface 1.
2
In the Settings window for Arrow Surface, locate the Data section.
3
From the Solution parameters list, choose From parent.
Arrow Surface 2
1
In the Model Builder window, click Arrow Surface 2.
2
In the Settings window for Arrow Surface, locate the Data section.
3
From the Solution parameters list, choose From parent.
4
Click to expand the Inherit Style section. From the Plot list, choose Arrow Surface 1.
Temperature, Top and Bottom
1
In the Model Builder window, under Results click Temperature, Top and Bottom.
2
In the Settings window for 1D Plot Group, locate the Legend section.
3
From the Position list, choose Upper left.