PDF

High-Intensity Focused Ultrasound (HIFU) Propagation Through a Tissue Phantom
Introduction
The high-intensity focused ultrasound is used in many different biomedical applications, such as thermal ablation of tumors, transcranial HIFU surgery, shock wave lithotripsy, and so on. A HIFU signal is focused on a small focal zone, where its intensity reaches higher levels. In this case, nonlinear effects may become significant and one speaks of the propagation of finite amplitude sound waves. The nonlinear nature of the phenomenon results in the energy transfer from lower to higher harmonics. The contribution of the higher-order harmonics grows with the propagation distance.
This example shows how to model nonlinear propagation of HIFU through a dissipative media using the Nonlinear Pressure Acoustics, Time Explicit physics interface. The interfaces solves the system of nonlinear acoustic equations in the form of a hyperbolic conservation law, see Ref. 1, using the discontinuous Galerkin finite element method (dG-FEM) and an explicit time integration scheme. The used approach is suitable when the cumulative nonlinear effects, that is, those cumulated through propagation, dominate the local nonlinear effects.
In this model, the emitted signal is a tone burst pulse that occupies only a limited part of the computational domain on its way. Adaptive mesh refinement is used for automatic remeshing following the signal propagation. This ensures that the mesh is fine enough to resolve the higher-order harmonics where it is required.
Model Definition
The focusing of an ultrasonic signal is typically achieved either by using a phase delay or a focusing lens on the transducer side. In this model, a spherically focused ultrasound transducer with a concave lens is used to emit the signal. The transducer housing and the lens are assumed to be rigid. The model setup is shown in Figure 1. The model geometry is axially symmetric.
The spherical lens of radius r and aperture a emits a signal that is focused at the focal point F located in the tissue phantom. The signal is a five-cycle tone burst with the amplitude P0 = 0.1 MPa and the center frequency f0 = 1 MHz as shown in Figure 2. The signal amplitude at the source location is enough th generate of higher-order harmonics, but not high enough for the formation of shocks, and therefore no special shock-capturing techniques are required in this model.
Figure 1: Model geometry.
The traveling time of the signal to the focal point can be computed as
,
where c and d are the speed of sound and the traveling distance in the corresponding materials, respectively. At the frequency of 1 MHz, the time to focus is approximately equal to 40/f0.
Figure 2: Source signal.
Results and Discussion
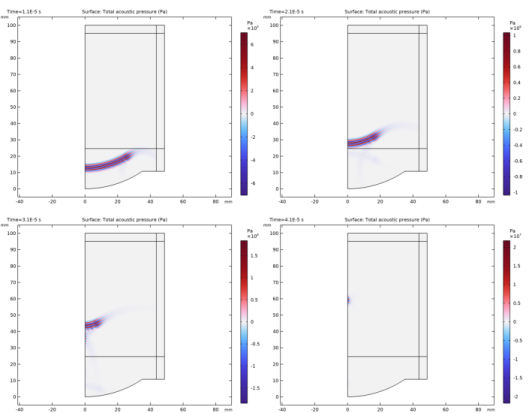
The evolution of the signal traveling from the source is illustrated in Figure 3. The tone burst pulse has left the source at t = 10 μs and travels toward the boundary between the water and the tissue phantom domains, which it passes at t = 20 μs with some part being reflected back to the source. The focusing of the signal becomes visible at t = 30 μs and reaches its maximum at t = 40 μs.
Figure 3: Propagation of the ultrasonic signal at times t = 10, 20, 30, and 40 μs.
Figure 3 also shows that the signal strength increases as it comes closer to the focal zone. This is confirmed by the plots of the signal at the water/tissue interface and at the focal point depicted in Figure 4. The acoustic pressure amplitude at the focal point is about 10 times greater than that at the water/tissue interface. Another observation is that the positive pressure peaks are almost twice as high as the negative ones, at the focal point. This indicated that the signal becomes highly nonlinear as it reaches the focal zone.
Figure 4: Acoustic pressure at the water/tissue interface and at the focal point.
Figure 5 shows the frequency content of the recorded signals. The frequency content of the signal entering the tissue phantom is not much different from the source signal. That is, the propagation up to this point is linear. The signal at the focal point is however highly nonlinear, which is seen from the number of generated higher-order harmonics.
The plots of the minimum and maximum on-axis pressure calculated are depicted in Figure 6. The values are computed according to the following formulas
(1)
and are normalized with respect to the maximum pressure at the focal point. Figure 6 shows that p+ is almost twice as high as p-, which is a distinctive feature of nonlinear propagation of a HIFU signal. The bounds of the focal zone are also seen in Figure 6.
Figure 5: Frequency spectrum of the acoustic pressure at the water/tissue interface and at the focal point.
Figure 6: Frequency spectrum of the acoustic pressure at the water/tissue interface and at the focal point.
Notes About the COMSOL Implementation
Mesh and Time Explicit Solver
While solving a wave propagation problem, the used mesh typically has to be fine enough to resolve the frequency content of the signal, that is, the specified number of the higher-order harmonics, N, as discussed in the tutorial Nonlinear Propagation of a Cylindrical Wave — Verification Model. However, a distinctive feature of the model is that the source signal is a pulse and therefore the propagating signal is finite in space. This suggests that a fine mesh is only required in a finite part of the computational domain where the signal is located at a certain time, thus saving a lot of DOFs. This is achievable by enabling the Adaptive mesh refinement option which can be found in the Adaptation section of the Time Dependent study step.
The initial mesh built in the model resolves the fundamental harmonic. With the default quartic discretization order, the mesh element size should not exceed 1.5 of the fundamental wavelength. The adaptive mesh refinement ensures that a finer mesh is created to resolve the propagating signal. On the Adaptive Mesh Refinement node, select General modification for the Adaptation method and clear the Allow coarsening check box. Thus the resulting mesh will always resolve the fundamental harmonic. Then make the Error indicator capture sharp gradients of the acoustic pressure by typing sqrt(comp1.pr^2+comp1.pz^2).
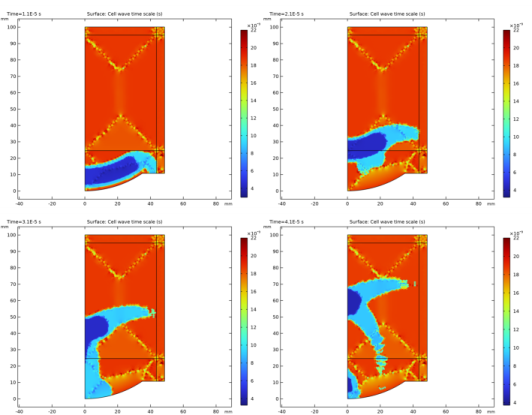
The Nonlinear Pressure Acoustic, Time Explicit physics is based on dG-FEM and uses an explicit time integration schemes. The solver time step obeys the CFL condition to ensure the stability of the time integration method. That is, Δ hmin/cmax(p), where hmin is the minimum mesh element size and cmax(p) is the maximum wave propagation speed. In the nonlinear case the speed of sound depends on the acoustic pressure. In this model, the mesh follows the nonlinear propagation of the signal and therefore will have smaller elements around the its sharp fronts and larger elements away from it. It is worth selecting the time-stepping method to Adam-Bashforth 3 (local) and enabling the Update time levels option available in the General section of the time-explicit solver. Figure 7 shows the values of the cell wave time scale elte.wtc variable, that the time step is proportional to. The smaller values are found for the smaller mesh elements in the vicinity of the signal, while the larger values are used in the rest of the computational domain.
Figure 7: Cell wave time scale at times t = 10, 20, 30, and 40 μs.
 
References
1. M.A. Diaz, M.A. Solovchuk, and T.W.H. Sheu, “A conservative numerical scheme for modeling nonlinear acoustic propagation in thermoviscous homogeneous media”, J. Comp. Phys., vol. 363, 2018.
Application Library path: Acoustics_Module/Ultrasound/hifu_tissue_sample
Modeling Instructions
From the File menu, choose New.
New
In the New window, click  Model Wizard.
Model Wizard
1
In the Model Wizard window, click  2D Axisymmetric.
2
In the Select Physics tree, select Acoustics>Ultrasound>Nonlinear Pressure Acoustics, Time Explicit (nate).
3
Click Add.
4
Click  Study.
5
In the Select Study tree, select General Studies>Time Dependent.
6
Global Definitions
Parameters 1
1
In the Model Builder window, under Global Definitions click Parameters 1.
2
In the Settings window for Parameters, locate the Parameters section.
3
Click  Load from File.
4
Rectangle 1 (rect1)
1
In the Home toolbar, click  Functions and choose Global>Rectangle.
2
In the Settings window for Rectangle, locate the Parameters section.
3
In the Lower limit text field, type 0.
4
In the Upper limit text field, type 5*T0.
5
Click to expand the Smoothing section. Clear the Size of transition zone check box.
Create a five-cycle tone burst source signal and inspect its frequency content.
Pulse
1
In the Home toolbar, click  Functions and choose Global>Analytic.
2
In the Settings window for Analytic, type Pulse in the Label text field.
3
In the Function name text field, type pulse.
4
Locate the Definition section. In the Expression text field, type sin(omega0*t)*(1 - cos(omega0*t/5))*rect1(t).
5
In the Arguments text field, type t.
6
Locate the Units section. In the table, enter the following settings:
7
In the Function text field, type 1.
8
Locate the Plot Parameters section. In the table, enter the following settings:
9
Click  Create Plot.
Results
Tone Burst Pulse
1
In the Settings window for 1D Plot Group, type Tone Burst Pulse in the Label text field.
Function 1
1
In the Model Builder window, expand the Tone Burst Pulse node, then click Function 1.
2
In the Settings window for Function, locate the Output section.
3
From the Display list, choose Discrete Fourier transform.
4
From the Show list, choose Frequency spectrum.
5
From the Scale list, choose Multiply by sampling period.
6
Select the Frequency range check box.
7
In the Maximum text field, type 3*f0.
8
In the Tone Burst Pulse toolbar, click  Plot.
The plot shows that the frequency content of the signal lies close to the center frequency f0.
Geometry 1
1
In the Model Builder window, under Component 1 (comp1) click Geometry 1.
2
In the Settings window for Geometry, locate the Units section.
3
From the Length unit list, choose mm.
Circle 1 (c1)
1
In the Geometry toolbar, click  Circle.
2
In the Settings window for Circle, locate the Size and Shape section.
3
In the Radius text field, type r_source.
4
Locate the Position section. In the z text field, type r_source.
5
Click  Build Selected.
Rectangle 1 (r1)
1
In the Geometry toolbar, click  Rectangle.
2
In the Settings window for Rectangle, locate the Size and Shape section.
3
In the Width text field, type w_source.
4
In the Height text field, type r_source-sqrt(r_source^2-w_source^2).
5
Click  Build Selected.
Intersection 1 (int1)
1
In the Geometry toolbar, click  Booleans and Partitions and choose Intersection.
2
Click in the Graphics window and then press Ctrl+A to select both objects.
3
In the Settings window for Intersection, click  Build Selected.
Rectangle 2 (r2)
1
In the Geometry toolbar, click  Rectangle.
2
In the Settings window for Rectangle, locate the Size and Shape section.
3
In the Width text field, type r_model+th_abs.
4
In the Height text field, type h_model+th_abs-z_tissue.
5
Locate the Position section. In the z text field, type z_tissue.
6
Click to expand the Layers section. In the table, enter the following settings:
7
Select the Layers to the right check box.
8
Clear the Layers on bottom check box.
9
Select the Layers on top check box.
10
Click  Build Selected.
11
Click the  Zoom Extents button in the Graphics toolbar.
Rectangle 3 (r3)
1
In the Geometry toolbar, click  Rectangle.
2
In the Settings window for Rectangle, locate the Size and Shape section.
3
In the Width text field, type r_model+th_abs.
4
In the Height text field, type z_tissue-(r_source-sqrt(r_source^2-w_source^2)).
5
Locate the Position section. In the z text field, type r_source-sqrt(r_source^2-w_source^2).
6
Locate the Layers section. In the table, enter the following settings:
7
Select the Layers to the right check box.
8
Clear the Layers on bottom check box.
9
Click  Build Selected.
Ignore Edges 1 (ige1)
1
In the Geometry toolbar, click  Virtual Operations and choose Ignore Edges.
2
On the object fin, select Boundary 3 only.
3
In the Geometry toolbar, click  Build All.
Create two domain probe points on the symmetry axis—one at the water/tissue interface and the other at the focal point—which will record the signal during its propagation from the source.
Definitions
Domain Point Probe 1
1
In the Definitions toolbar, click  Probes and choose Domain Point Probe.
2
In the Settings window for Domain Point Probe, locate the Point Selection section.
3
In row Coordinates, set z to z_tissue.
Point Probe Expression 1 (ppb1)
1
In the Model Builder window, expand the Domain Point Probe 1 node, then click Point Probe Expression 1 (ppb1).
2
In the Settings window for Point Probe Expression, locate the Expression section.
3
In the Expression text field, type nate.p_t/P0.
Domain Point Probe 2
1
In the Definitions toolbar, click  Probes and choose Domain Point Probe.
2
In the Model Builder window, click Domain Point Probe 2.
3
In the Settings window for Domain Point Probe, locate the Point Selection section.
4
In row Coordinates, set z to F.
Point Probe Expression 2 (ppb2)
1
In the Model Builder window, click Point Probe Expression 2 (ppb2).
2
In the Settings window for Point Probe Expression, locate the Expression section.
3
In the Expression text field, type nate.p_t/P0.
Now, set up the absorbing layers (sponge layers) used to truncate the computational domain.
Absorbing Layer 1 (ab1)
1
In the Definitions toolbar, click  Absorbing Layer.
2
3
In the Settings window for Absorbing Layer, locate the Geometry section.
4
From the Type list, choose Cylindrical.
Nonlinear Pressure Acoustics, Time Explicit (nate)
Nonlinear Pressure Acoustics, Time Explicit Model 1
1
In the Model Builder window, under Component 1 (comp1)>Nonlinear Pressure Acoustics, Time Explicit (nate) click Nonlinear Pressure Acoustics, Time Explicit Model 1.
2
In the Settings window for Nonlinear Pressure Acoustics, Time Explicit Model, locate the Pressure Acoustics Model section.
3
From the Fluid model list, choose General dissipation.
Impose the Material Discontinuity boundary condition upon the interface between the water and the tissue parts of the computational domain.
Material Discontinuity 1
1
In the Physics toolbar, click  Boundaries and choose Material Discontinuity.
2
Pressure 1
1
In the Physics toolbar, click  Boundaries and choose Pressure.
2
3
In the Settings window for Pressure, locate the Pressure section.
4
In the p0(t) text field, type P0*pulse(t).
Impedance 1
1
In the Physics toolbar, click  Boundaries and choose Impedance.
2
It is also of interest to compute the minimum and maximum acoustic pressure on the symmetry axis over the simulated time interval.
Nonlinear Pressure Acoustics, Time Explicit Model 1
In the Model Builder window, click Nonlinear Pressure Acoustics, Time Explicit Model 1.
Compute Minimum and Maximum Pressure 1
1
In the Physics toolbar, click  Attributes and choose Compute Minimum and Maximum Pressure.
2
Set up the materials. The physics interface and the chosen fluid model will suggest which material properties should be defined.
Materials
Water
1
In the Model Builder window, under Component 1 (comp1) right-click Materials and choose Blank Material.
2
In the Settings window for Material, type Water in the Label text field.
3
4
Locate the Material Contents section. In the table, enter the following settings:
Tissue
1
Right-click Materials and choose Blank Material.
2
In the Settings window for Material, type Tissue in the Label text field.
3
4
Locate the Material Contents section. In the table, enter the following settings:
Now, proceed to the mesh. Even though the problem at hand is nonlinear, make the mesh resolve only the fundamental harmonic. To do it, limit the maximum element size by 1.5 of the wavelength in the corresponding materials.
Mesh 1
Free Triangular 1
In the Mesh toolbar, click  Free Triangular.
Size 1
1
Right-click Free Triangular 1 and choose Size.
2
In the Settings window for Size, locate the Geometric Entity Selection section.
3
From the Geometric entity level list, choose Domain.
4
5
Locate the Element Size section. Click the Custom button.
6
Locate the Element Size Parameters section.
7
Select the Maximum element size check box. In the associated text field, type c_water/f0/1.5.
Size 2
1
In the Model Builder window, right-click Free Triangular 1 and choose Size.
2
In the Settings window for Size, locate the Geometric Entity Selection section.
3
From the Geometric entity level list, choose Domain.
4
5
Locate the Element Size section. Click the Custom button.
6
Locate the Element Size Parameters section.
7
Select the Maximum element size check box. In the associated text field, type c_tissue/f0/1.5.
8
Click  Build All.
Study 1
Step 1: Time Dependent
1
In the Model Builder window, under Study 1 click Step 1: Time Dependent.
2
In the Settings window for Time Dependent, locate the Study Settings section.
3
In the Output times text field, type range(0, T0, 55*T0).
This setting saves the solution at times multiple to T0 in the whole computational domain. It only influences the stored solution (and thus the file size). The internal time steps taken by the solver are automatically controlled by COMSOL to fulfill the appropriate CFL condition.
On the other hand, the signals at the probes will be computed for each time step taken by the solver thus providing a much higher temporal resolution of the results.
4
Click to expand the Adaptation section. From the Adaptive mesh refinement list, choose Adaptive mesh refinement.
5
Find the Mesh element control subsection. From the Adaptation method list, choose General modification.
This setting enables the adaptation of the mesh with respect to the propagating signal by creating intermediate meshes. Those will be fine enough in the parts of the computational domain where it is required to resolve higher-order harmonics generated because of the nonlinear nature of the problem.
Solution 1 (sol1)
1
In the Study toolbar, click  Show Default Solver.
2
In the Model Builder window, expand the Solution 1 (sol1) node, then click Time-Dependent Solver 1.
3
In the Settings window for Time-Dependent Solver, click to expand the Time Stepping section.
4
From the Method list, choose AdamsBashforth 3 (local).
5
From the Update time levels list, choose Factor.
The Adams-Bashforth 3 (local) time-stepping method uses local time steps chosen in accordance with the size of mesh elements.
6
In the Model Builder window, expand the Study 1>Solver Configurations>Solution 1 (sol1)>Time-Dependent Solver 1 node, then click Adaptive Mesh Refinement.
7
In the Settings window for Adaptive Mesh Refinement, locate the General section.
8
Clear the Allow coarsening check box.
This setting makes sure that the intermediate meshes will still be fine enough to resolve the fundamental harmonic.
9
Locate the Error Estimation section. In the table, enter the following settings:
This makes the Error indicator trace the sharp gradients of the acoustic pressure.
10
In the Study toolbar, click  Compute.
Results
Acoustic Pressure (nate)
All the plots are depicted in the previous sections of the documentation.
Relative Pressure Probes
1
In the Model Builder window, expand the Results>Probe Plot Group 4 node, then click Probe Plot Group 4.
2
In the Settings window for 1D Plot Group, type Relative Pressure Probes in the Label text field.
3
Click to expand the Title section. From the Title type list, choose Label.
4
Locate the Legend section. From the Position list, choose Upper left.
Probe Table Graph 1
1
In the Model Builder window, click Probe Table Graph 1.
2
In the Relative Pressure Probes toolbar, click  Plot.
Relative Pressure Probes, Frequency Spectrum
1
In the Model Builder window, right-click Relative Pressure Probes and choose Duplicate.
2
In the Model Builder window, click Relative Pressure Probes 1.
3
In the Settings window for 1D Plot Group, type Relative Pressure Probes, Frequency Spectrum in the Label text field.
4
Locate the Legend section. From the Position list, choose Upper right.
Probe Table Graph 1
1
In the Model Builder window, click Probe Table Graph 1.
2
In the Settings window for Table Graph, locate the Data section.
3
From the Transformation list, choose Discrete Fourier transform.
4
From the Show list, choose Frequency spectrum.
5
From the Scale list, choose Multiply by sampling period.
6
Select the Frequency range check box.
7
In the Maximum text field, type 5*f0.
8
In the Relative Pressure Probes, Frequency Spectrum toolbar, click  Plot.
On-Axis Relative Pressure
1
In the Home toolbar, click  Add Plot Group and choose 1D Plot Group.
2
In the Settings window for 1D Plot Group, type On-Axis Relative Pressure in the Label text field.
3
Locate the Data section. From the Dataset list, choose Study 1/Refined Mesh Solution 1 (sol2).
4
From the Time selection list, choose From list.
5
In the Times (s) list, select 4.1E-5.
6
Locate the Title section. From the Title type list, choose Label.
Line Graph 1
1
Right-click On-Axis Relative Pressure and choose Line Graph.
2
3
In the Settings window for Line Graph, locate the y-Axis Data section.
4
In the Expression text field, type nate.p_t/P0.
5
Locate the x-Axis Data section. From the Parameter list, choose Expression.
6
In the Expression text field, type z/F.
7
In the On-Axis Relative Pressure toolbar, click  Plot.
Normalized Positive and Negative Pressure
1
In the Home toolbar, click  Add Plot Group and choose 1D Plot Group.
2
In the Settings window for 1D Plot Group, type Normalized Positive and Negative Pressure in the Label text field.
3
Locate the Data section. From the Dataset list, choose Study 1/Refined Mesh Solution 1 (sol2).
4
From the Time selection list, choose Last.
Line Graph 1
1
Right-click Normalized Positive and Negative Pressure and choose Line Graph.
2
3
In the Settings window for Line Graph, click Replace Expression in the upper-right corner of the y-Axis Data section. From the menu, choose Component 1 (comp1)>Nonlinear Pressure Acoustics, Time Explicit>Pressure and sound pressure level>nate.p_max - Maximum acoustic pressure - Pa.
4
Locate the y-Axis Data section. In the Expression text field, type nate.p_max/at1(0, F, nate.p_max).
5
Locate the x-Axis Data section. From the Parameter list, choose Expression.
6
In the Expression text field, type z/F.
7
Click to expand the Legends section. Select the Show legends check box.
8
From the Legends list, choose Manual.
9
10
Click to expand the Quality section. From the Resolution list, choose No refinement.
Line Graph 2
1
Right-click Line Graph 1 and choose Duplicate.
2
In the Settings window for Line Graph, click Replace Expression in the upper-right corner of the y-Axis Data section. From the menu, choose Component 1 (comp1)>Nonlinear Pressure Acoustics, Time Explicit>Pressure and sound pressure level>nate.p_min - Minimum acoustic pressure - Pa.
3
Locate the y-Axis Data section. In the Expression text field, type -nate.p_min/at1(0, F, nate.p_max).
4
Locate the Legends section. In the table, enter the following settings:
5
In the Normalized Positive and Negative Pressure toolbar, click  Plot.
Cell Wave Time Scale
In the Home toolbar, click  Add Plot Group and choose 2D Plot Group.
Inspect the local cell wave time scale, which the time step is proportional to.
1
In the Settings window for 2D Plot Group, locate the Data section.
2
From the Dataset list, choose Study 1/Refined Mesh Solution 1 (sol2).
3
Click  Plot Last.
4
In the Label text field, type Cell Wave Time Scale.
Surface 1
1
Right-click Cell Wave Time Scale and choose Surface.
2
In the Settings window for Surface, click Replace Expression in the upper-right corner of the Expression section. From the menu, choose Component 1 (comp1)>Nonlinear Pressure Acoustics, Time Explicit>Cell time scale>nate.wtc - Cell wave time scale - s.
3
Click to expand the Quality section. From the Resolution list, choose No refinement.
4
From the Smoothing list, choose None.
5
In the Cell Wave Time Scale toolbar, click  Plot.