PDF

Acoustic Scattering off an Ellipsoid
Introduction
This example studies the scattering of an incident plane acoustic wave off a rigid ellipsoid geometry. The model utilizes the scattered field formulation, which enables the separation of the incident (background) pressure field and the scattered field. Using the Exterior Field Calculation feature, the scattered field is determined at a given distance outside the computational domain. The results are presented as 3D cross-section plots and as polar plots of the scattered exterior pressure and sound pressure level.
Model Definition
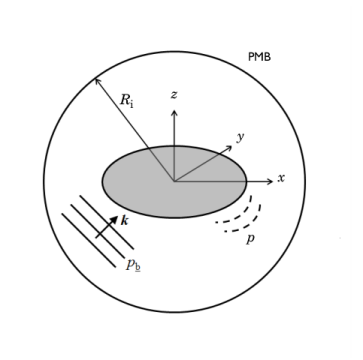
Figure 1 shows a sketch of the modeled system. A rigid ellipsoid is hit by an incident plane wave (here named the background pressure field pb). The scattered field off the ellipsoid is denoted p.
Figure 1: Sketch of the modeled system showing geometric scales, the computation domain bounded by the PMB, the incident background pressure field pb, and the scattered field p.
The total acoustic field pt is given by the sum of the scattered and the background pressure fields such that
(1)
The background pressure field is a plane wave of amplitude p0 moving in the direction k with wave number |k| = 2πf0/c0, where f0 is the frequency and c0 is the speed of sound. The governing equations are implemented as a scattered field formulation such that only the scattered field p is solved for. See the Acoustics Module User’s Guide for information about the background pressure field feature.
The ellipsoid is located inside a computational domain of radius Ri, terminated by a perfectly matched boundary (PMB). The PMB sets up a perfectly matched layer without adding a domain to the geometry. It is used as a non-reflecting and absorbing boundary that mimics a domain stretching to infinity. For more information about PMBs in acoustics, see The Pressure Acoustics, Frequency Domain Interface section in the Pressure Acoustics Module User’s Guide.
The surrounding fluid in this model is water. Approximate physical quantities (for water at 20°C) and dimensions, used in the model, are given in the table below.
Ri
Rext
f0
c0
λmin
Mesh
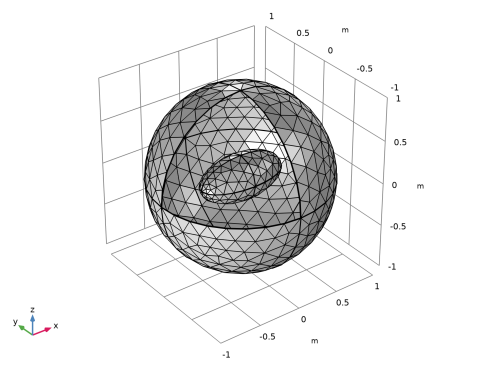
When modeling a wave problem, the computational mesh has to provide sufficient resolution of the waves. In 3D acoustic models, it is necessary to have a minimum of 5 elements per wavelength when using second-order elements (this is the default element for pressure acoustics). In this model, 6 elements per wavelength are used. The mesh size as well as proper meshing of the boundary used for the exterior field calculation feature is automatically set up when using the Physics-controlled mesh functionality for pressure acoustics.
Figure 2: Illustration of the mesh on the boundary of the computational domain and the mesh on the ellipsoid surface.
EXTERIOR Field
After solving a pressure acoustics model, it is possible to determine the pressure outside the computational domain using the exterior field calculation feature. The exterior field calculation feature solves the Helmholtz-Kirchhoff (H-K) integral on the selected boundaries. The selected boundaries need to form a closed surface around all sources and scatterers. If the model has symmetries, these can be included. Note that two versions of the H-K integral exist, one that only determines the pressure at the infinity limit (an approximation to the H-K integral is then used) and one version that solves the full H-K integral. In this model, we use the full integral and can thus determine the exact exterior-field pressure (including phase) at any point and distance outside the computational domain.
Figure 3: Relation between a coordinate defined in the exterior field boundary xi and the coordinate x at a distance Rext.
For plotting purposes, the exterior-field pressure variable pext is defined by COMSOL. This variable defines the pressure at any coordinates x, y, and z that are outside the boundary on which the exterior-field calculation is defined (for |x| > Ri in Figure 3). The exterior-field pressure (variable name acpr.efc1.pext) and exterior-field sound pressure level (variable name acpr.ffc1.Lp_pext) are easily plotted and visualized using the radiation pattern plot types. They exist in 1D plot groups for plotting on, for example, a polar plot group, in 2D plot groups, and in 3D plot groups for creating 3D polar plots.
Finally, note that in order to get a precise evaluation of the exterior-field variable, the evaluation of the H-K integral must be accurate. This requires having a good numerical estimate of the normal derivative of the pressure on the exterior-field calculation surface. This is achieved using a single boundary-layer mesh. This is automatically handled by the physics-controlled mesh.
Results and Discussion
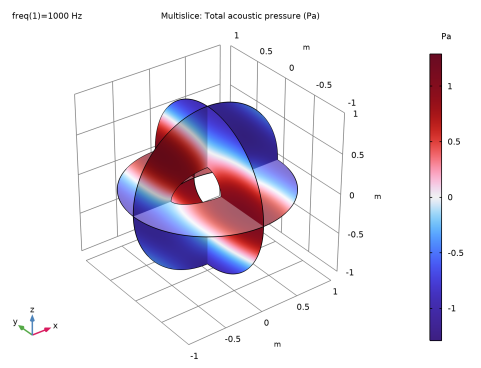
Figure 4 shows the total acoustic field pt. It is the sum of the scattered field p and the incident background pressure field pb, shown in Figure 5.
Figure 4: Total acoustic field at f = 1000 Hz.
Figure 5: Scattered acoustic field (top) and incident plane-wave acoustic field (bottom).
Figure 6 plots the pressure in the exterior field at the distance Rext = 10 m. The data is retrieved in the xy-plane and presented as a polar plot, with 0° corresponding to the positive x direction. The sound pressure level in the exterior field is likewise represented in a polar plot in Figure 7. It is easy to determine the pressure and sound pressure level at another distance; simply change the parameter value for Rext under the parameters and update the solution (press F5). The plots are then updated accordingly.
Figure 6: Polar plot of the pressure p at distance Rext = 10 m from the origin. The plot represents data in the xy-plane.
Figure 7: Polar plot of the exterior-field sound pressure level in the xy-plane.
The spatial response is visualized as a 3D radiation pattern plot in Figure 8. The plot represents the sound pressure level. The radial dB scale zero-point has been moved to 66 dB in order to enhance the visualization of the notches in the radiation pattern. The surface color scale is the actual sound pressure level.
Finally, in Figure 9 the pressure is plotted outside of the computational mesh using the Grid 3D dataset. Here, the scattered pressure pext(x,y,z) is shown. Alternatively, visualize the sound pressure level by plotting acpr.efc1.Lp_pext.
Figure 8: 3D radiation pattern plot of the sound pressure level. The surface color scale is the actual sound pressure level.
Figure 9: Scattered field outside the computational mesh plotted using the grid dataset and the exterior-field variable pext.
Application Library path: Acoustics_Module/Tutorials,_Pressure_Acoustics/acoustic_scattering
Modeling Instructions
From the File menu, choose New.
New
In the New window, click  Model Wizard.
Model Wizard
1
In the Model Wizard window, click  3D.
2
In the Select Physics tree, select Acoustics>Pressure Acoustics>Pressure Acoustics, Frequency Domain (acpr).
3
Click Add.
4
Click  Study.
5
In the Select Study tree, select General Studies>Frequency Domain.
6
Global Definitions
Load the parameters defining the physical values and the geometric dimensions of the system from file (see Table 1).
Parameters 1
1
In the Model Builder window, under Global Definitions click Parameters 1.
2
In the Settings window for Parameters, locate the Parameters section.
3
Click  Load from File.
4
Geometry 1
Ellipsoid 1 (elp1)
1
In the Geometry toolbar, click  More Primitives and choose Ellipsoid.
2
In the Settings window for Ellipsoid, locate the Size and Shape section.
3
In the a-semiaxis text field, type A.
4
In the b-semiaxis text field, type B.
5
In the c-semiaxis text field, type C.
Sphere 1 (sph1)
1
In the Geometry toolbar, click  Sphere.
2
In the Settings window for Sphere, locate the Size section.
3
In the Radius text field, type Ri.
4
Click  Build Selected.
5
Click the  Zoom Extents button in the Graphics toolbar to see the full geometry and then select wireframe rendering for easier visualization of the internal geometry. This makes selecting internal domains and boundaries much easier.
6
Click the  Wireframe Rendering button in the Graphics toolbar.
Difference 1 (dif1)
1
In the Geometry toolbar, click  Booleans and Partitions and choose Difference.
2
3
In the Settings window for Difference, locate the Difference section.
4
Find the Objects to subtract subsection. Click to select the  Activate Selection toggle button.
5
6
Click  Build All Objects.
The geometry should look like that in the figure below.
Add a selection for the boundaries on which the exterior field is calculated. These boundaries must surround all scatterers, in this case the ellipsoid.
Definitions
Exterior Field
1
In the Definitions toolbar, click  Explicit.
2
In the Settings window for Explicit, locate the Input Entities section.
3
From the Geometric entity level list, choose Boundary.
4
5
In the Label text field, type Exterior Field.
Add Material
1
In the Home toolbar, click  Add Material to open the Add Material window.
2
Go to the Add Material window.
3
In the tree, select Built-in>Water, liquid.
4
Click Add to Component in the window toolbar.
5
In the Home toolbar, click  Add Material to close the Add Material window.
Set the model reference pressure to 1 Pa, the default for water, and set the reference speed of sound to that in water. The latter option is used to determine the scaling used in the perfectly matched boundary.
Pressure Acoustics, Frequency Domain (acpr)
1
In the Model Builder window, under Component 1 (comp1) click Pressure Acoustics, Frequency Domain (acpr).
2
In the Settings window for Pressure Acoustics, Frequency Domain, locate the Sound Pressure Level Settings section.
3
From the Reference pressure for the sound pressure level list, choose Use reference pressure for water.
The incident pressure field is defined as a Background Pressure Field domain contribution. In this model the incident wave has an amplitude of p0 = 1 Pa and is traveling in the direction ek = (1,0,1).
Background Pressure Field 1
1
In the Physics toolbar, click  Domains and choose Background Pressure Field.
2
3
In the Settings window for Background Pressure Field, locate the Background Pressure Field section.
4
In the p0 text field, type 1.
5
From the c list, choose From material.
6
From the Material list, choose Water, liquid (mat1).
7
Specify the ek vector as
Now set up the exterior-field calculation.
Exterior Field Calculation 1
1
In the Physics toolbar, click  Boundaries and choose Exterior Field Calculation.
2
In the Settings window for Exterior Field Calculation, locate the Boundary Selection section.
3
From the Selection list, choose Exterior Field.
As last step before meshing the model add the perfectly matched boundary.
Perfectly Matched Boundary 1
1
In the Physics toolbar, click  Boundaries and choose Perfectly Matched Boundary.
2
In the Settings window for Perfectly Matched Boundary, locate the Boundary Selection section.
3
From the Selection list, choose Exterior Field.
Mesh
Proceed and generate the mesh using the Physics-controlled mesh functionality. The frequency controlling the maximum element size is per default taken From study. Set the desired Frequencies in the study step. In general, 5 to 6 second-order elements per wavelength are needed to resolve the waves. For more details see Meshing (Resolving the Waves) in the Acoustics Module User’s Guide. In this model, we use 6 elements per wavelength; the default Automatic is to have 5.
Study 1
Step 1: Frequency Domain
1
In the Model Builder window, under Study 1 click Step 1: Frequency Domain.
2
In the Settings window for Frequency Domain, locate the Study Settings section.
3
In the Frequencies text field, type f0.
Mesh 1
1
In the Model Builder window, under Component 1 (comp1) click Mesh 1.
2
In the Settings window for Mesh, locate the Pressure Acoustics, Frequency Domain (acpr) section.
3
From the Number of mesh elements per wavelength list, choose User defined.
4
5
Click  Build All.
Now inspect the generated mesh. Hide some domains and boundaries to get a better view of the interior parts of the mesh.
6
In the Model Builder window, click Mesh 1.
7
In the Graphics window toolbar, clicknext to  Select Boundaries, then choose Select Boundaries.
8
Click the  Click and Hide button in the Graphics toolbar. Clicking on a boundary now hides rather than selects it.
9
The mesh should look like the one depicted in Figure 2.
Now reset the hiding in order to see the full model when processing the results.
10
Click the  Reset Hiding button in the Graphics toolbar.
11
Click the  Click and Hide button in the Graphics toolbar to restore the default click behavior.
Now proceed and solve the model.
Study 1
1
In the Model Builder window, click Study 1.
2
In the Settings window for Study, locate the Study Settings section.
3
Clear the Generate default plots check box.
4
In the Home toolbar, click  Compute.
Results
Plot the total acoustic field (Equation 1).
Total Field
1
In the Model Builder window, expand the Results node.
2
Right-click Results and choose 3D Plot Group.
3
In the Settings window for 3D Plot Group, type Total Field in the Label text field.
4
Locate the Color Legend section. Select the Show units check box.
Multislice 1
1
In the Total Field toolbar, click  More Plots and choose Multislice.
2
In the Settings window for Multislice, locate the Coloring and Style section.
3
Click  Change Color Table.
4
In the Color Table dialog box, select Wave>Wave in the tree.
5
6
In the Settings window for Multislice, locate the Coloring and Style section.
7
From the Scale list, choose Linear symmetric.
8
In the Total Field toolbar, click  Plot.
Total Field
The resulting plot should look like Figure 4.
Scattered Field
1
In the Model Builder window, right-click Total Field and choose Duplicate.
2
In the Settings window for 3D Plot Group, type Scattered Field in the Label text field.
To reproduce the plot of the scattered acoustic field shown in Figure 5 (top), proceed as follows:
Multislice 1
1
In the Model Builder window, expand the Scattered Field node, then click Multislice 1.
2
In the Settings window for Multislice, locate the Expression section.
3
In the Expression text field, type acpr.p_s.
4
Locate the Coloring and Style section. Click  Change Color Table.
5
In the Color Table dialog box, select Wave>Wave in the tree.
6
7
In the Settings window for Multislice, locate the Coloring and Style section.
8
From the Scale list, choose Linear symmetric.
9
In the Scattered Field toolbar, click  Plot.
Background Field
1
In the Model Builder window, right-click Scattered Field and choose Duplicate.
2
In the Settings window for 3D Plot Group, type Background Field in the Label text field.
Multislice 1
1
In the Model Builder window, expand the Background Field node, then click Multislice 1.
2
In the Settings window for Multislice, locate the Expression section.
3
In the Expression text field, type acpr.p_b.
4
Locate the Coloring and Style section. Click  Change Color Table.
5
In the Color Table dialog box, select Wave>Wave in the tree.
6
7
In the Settings window for Multislice, locate the Coloring and Style section.
8
From the Scale list, choose Linear symmetric.
9
In the Background Field toolbar, click  Plot.
Background Field
This plot represents the background or incident acoustic field, and should look like the plot in Figure 5 (bottom).
Sound Pressure Level
1
In the Model Builder window, right-click Background Field and choose Duplicate.
2
In the Settings window for 3D Plot Group, type Sound Pressure Level in the Label text field.
3
Locate the Color Legend section. Select the Show units check box.
Multislice 1
1
In the Model Builder window, expand the Sound Pressure Level node, then click Multislice 1.
2
In the Settings window for Multislice, locate the Expression section.
3
In the Expression text field, type acpr.Lp_s.
4
Locate the Coloring and Style section. Click  Change Color Table.
5
In the Color Table dialog box, select Rainbow>Rainbow in the tree.
6
7
In the Settings window for Multislice, locate the Coloring and Style section.
8
From the Scale list, choose Linear.
9
In the Sound Pressure Level toolbar, click  Plot.
Continue with visualization of the scattered exterior-field pressure and sound pressure level at the distance Rext = 10 m. Use the dedicated Radiation Pattern plots.
Reproduce the scattered pressure field (Figure 6) and the sound pressure level of the scattered pressure field (Figure 7) at a distance of 10 m from the center of the ellipsoid in the xy-plane as follows:
Exterior-Field Pressure, xy-Plane
1
In the Home toolbar, click  Add Plot Group and choose Polar Plot Group.
2
In the Settings window for Polar Plot Group, type Exterior-Field Pressure, xy-Plane in the Label text field.
Radiation Pattern 1
1
In the Exterior-Field Pressure, xy-Plane toolbar, click  More Plots and choose Radiation Pattern.
2
In the Settings window for Radiation Pattern, locate the Expression section.
3
In the Expression text field, type acpr.efc1.pext.
By default the real part of a variable is plotted. If you need the imaginary part, write imag(acpr.efc1.pext), or if you need the absolute value, write abs(acpr.efc1.pext).
4
Locate the Evaluation section. Find the Evaluation distance subsection. In the Radius text field, type Rext.
5
In the Exterior-Field Pressure, xy-Plane toolbar, click  Plot.
Exterior-Field SPL, xy-Plane
1
In the Model Builder window, right-click Exterior-Field Pressure, xy-Plane and choose Duplicate.
2
In the Settings window for Polar Plot Group, type Exterior-Field SPL, xy-Plane in the Label text field.
Radiation Pattern 1
1
In the Model Builder window, expand the Exterior-Field SPL, xy-Plane node, then click Radiation Pattern 1.
2
In the Settings window for Radiation Pattern, locate the Expression section.
3
In the Expression text field, type acpr.efc1.Lp_pext.
4
In the Exterior-Field SPL, xy-Plane toolbar, click  Plot.
Now, plot the scattered pressure field and the sound pressure level of the scattered pressure field at a distance of 10 m from the ellipsoid in the yz-plane. Note that the yz-plane has the normal in the x direction.
Exterior-Field Pressure, yz-Plane
1
In the Model Builder window, right-click Exterior-Field Pressure, xy-Plane and choose Duplicate.
2
In the Settings window for Polar Plot Group, type Exterior-Field Pressure, yz-Plane in the Label text field.
Radiation Pattern 1
Set the reference direction. It defines the direction in space that corresponds to 0 deg. in the polar plot.
1
In the Model Builder window, expand the Exterior-Field Pressure, yz-Plane node, then click Radiation Pattern 1.
2
In the Settings window for Radiation Pattern, locate the Evaluation section.
3
Find the Reference direction subsection. In the x text field, type 0.
4
In the y text field, type 1.
Set the normal to get the yz-plane.
5
Find the Normal vector subsection. In the x text field, type 1.
6
In the z text field, type 0.
7
In the Exterior-Field Pressure, yz-Plane toolbar, click  Plot.
Exterior-Field SPL, yz-Plane
1
In the Model Builder window, right-click Exterior-Field SPL, xy-Plane and choose Duplicate.
2
In the Settings window for Polar Plot Group, type Exterior-Field SPL, yz-Plane in the Label text field.
Radiation Pattern 1
1
In the Model Builder window, expand the Exterior-Field SPL, yz-Plane node, then click Radiation Pattern 1.
2
In the Settings window for Radiation Pattern, locate the Evaluation section.
3
Find the Reference direction subsection. In the x text field, type 0.
4
In the y text field, type 1.
5
Find the Normal vector subsection. In the x text field, type 1.
6
In the z text field, type 0.
7
In the Exterior-Field SPL, yz-Plane toolbar, click  Plot.
Finally, plot the exterior-field sound pressure level as a 3D polar plot.
8
In the Home toolbar, click  Add Predefined Plot.
Add Predefined Plot
1
Go to the Add Predefined Plot window.
2
In the tree, select Study 1/Solution 1 (sol1)>Pressure Acoustics, Frequency Domain>Exterior-Field Sound Pressure Level (acpr).
3
Click Add Plot in the window toolbar.
4
In the Home toolbar, click  Add Predefined Plot.
Results
Exterior-Field Sound Pressure Level (acpr)
Create a new view for this figure. This will keep the view and zoom settings on all the previous figures.
1
In the Model Builder window, under Results click Exterior-Field Sound Pressure Level (acpr).
2
In the Settings window for 3D Plot Group, locate the Plot Settings section.
3
From the View list, choose New view.
Radiation Pattern 1
1
In the Model Builder window, expand the Exterior-Field Sound Pressure Level (acpr) node, then click Radiation Pattern 1.
2
In the Settings window for Radiation Pattern, locate the Evaluation section.
3
Find the Sphere subsection. From the Sphere list, choose Manual.
4
In the Radius text field, type Rext.
5
In the Exterior-Field Sound Pressure Level (acpr) toolbar, click  Plot.
6
Click the  Zoom Extents button in the Graphics toolbar.
The figure should look like the one below. Click on the figure and rotate it to get a sense of the 3D spatial response of the sound pressure level of the scattered field.
In order to better visualize the spatial response, change the plot expression by subtracting 66 dB. This will move the dB scale zero point. The color scale on the surface still represents the sound pressure level. The plot should look like the one in Figure 8.
7
Locate the Expression section. In the Expression text field, type acpr.efc1.Lp_pext-66.
8
Select the Description check box. In the associated text field, type Exterior-field sound pressure level.
9
Clear the Use as color expression check box.
10
In the Exterior-Field Sound Pressure Level (acpr) toolbar, click  Plot.
Finally, create and use a grid 3D dataset to plot the pressure field in the xy-plane outside of the computational mesh, reproducing Figure 9.
The settings for the grid dataset can be modified to show other cross sections. The plot can also be modified to, for example, plot the sound pressure level acpr.efc1.Lp_pext.
Grid 3D 1
1
In the Results toolbar, click  More Datasets and choose Grid>Grid 3D.
2
In the Settings window for Grid 3D, locate the Parameter Bounds section.
3
Find the First parameter subsection. In the Minimum text field, type -10.
4
In the Maximum text field, type 10.
5
Find the Second parameter subsection. In the Minimum text field, type -10.
6
In the Maximum text field, type 10.
7
Find the Third parameter subsection. In the Maximum text field, type 0.
8
Click to expand the Grid section. In the x resolution text field, type 300.
9
In the y resolution text field, type 300.
10
In the z resolution text field, type 2.
Exterior Pressure Field
1
In the Results toolbar, click  3D Plot Group.
2
In the Settings window for 3D Plot Group, type Exterior Pressure Field in the Label text field.
3
Locate the Plot Settings section. From the View list, choose View 3D 3.
4
Locate the Color Legend section. Select the Show units check box.
Surface 1
1
Right-click Exterior Pressure Field and choose Surface.
2
In the Settings window for Surface, locate the Data section.
3
From the Dataset list, choose Grid 3D 1.
4
Locate the Expression section. In the Expression text field, type acpr.efc1.pext.
5
Locate the Coloring and Style section. Click  Change Color Table.
6
In the Color Table dialog box, select Wave>Wave in the tree.
7
8
In the Settings window for Surface, locate the Coloring and Style section.
9
From the Scale list, choose Linear symmetric.
Filter 1
1
Right-click Surface 1 and choose Filter.
2
In the Settings window for Filter, locate the Element Selection section.
3
In the Logical expression for inclusion text field, type sqrt(x^2+y^2+z^2)>Ri*1.05.
4
In the Exterior Pressure Field toolbar, click  Plot.