|
|
|

|
1
|
|
2
|
|
3
|
Click Add.
|
|
4
|
Click
|
|
5
|
In the Select Study tree, select Preset Studies for Selected Physics Interfaces>Semiconductor Equilibrium.
|
|
6
|
Click
|
|
1
|
|
2
|
|
1
|
|
2
|
|
3
|
|
1
|
|
2
|
|
4
|
|
1
|
|
2
|
In the Settings window for Interpolation, type Interpolation 1: solar spectrum in the Label text field.
|
|
3
|
|
4
|
Click
|
|
5
|
Browse to the model’s Application Libraries folder and double-click the file si_solar_cell_1d_AM15_approx.txt.
|
|
6
|
Find the Functions subsection. In the table, enter the following settings:
|
|
7
|
|
8
|
In the Function table, enter the following settings:
|
|
9
|
|
1
|
|
2
|
In the Settings window for Interpolation, type Interpolation 2: Si absorption spectrum in the Label text field.
|
|
3
|
|
4
|
Click
|
|
5
|
Browse to the model’s Application Libraries folder and double-click the file si_solar_cell_1d_n_k_data.txt.
|
|
6
|
|
7
|
Find the Functions subsection. In the table, enter the following settings:
|
|
8
|
|
9
|
In the Argument table, enter the following settings:
|
|
10
|
|
1
|
In the Model Builder window, under Component 1 (comp1) right-click Definitions and choose Variables.
|
|
2
|
|
3
|
|
4
|
|
5
|
Locate the Variables section. In the table, enter the following settings:
|
|
1
|
|
2
|
|
3
|
|
4
|
|
5
|
|
1
|
|
2
|
|
3
|
|
4
|
|
1
|
|
2
|
|
3
|
|
4
|
|
1
|
|
2
|
|
3
|
|
4
|
|
5
|
|
6
|
|
1
|
In the Model Builder window, expand the Geometric Doping Model 1 node, then click Boundary Selection for Doping Profile 1.
|
|
1
|
|
2
|
|
3
|
|
1
|
|
2
|
|
3
|
|
4
|
|
5
|
|
1
|
|
1
|
|
3
|
|
4
|
|
1
|
|
2
|
|
3
|
|
2
|
|
3
|
|
4
|
|
5
|
|
1
|
|
2
|
|
3
|
|
4
|
Click
|
|
6
|
|
1
|
|
2
|
|
3
|
|
1
|
|
2
|
|
3
|
|
4
|
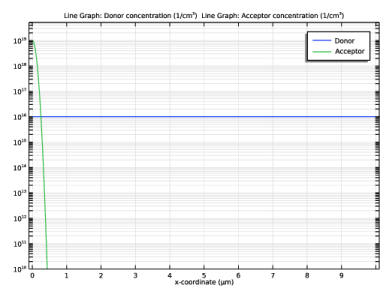
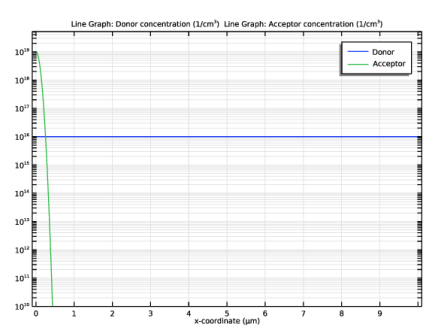
Click Replace Expression in the upper-right corner of the y-Axis Data section. From the menu, choose Component 1 (comp1)>Semiconductor>Carriers and dopants>Dopant concentrations>semi.Nd - Donor concentration - 1/m³.
|
|
5
|
|
6
|
|
7
|
|
8
|
|
9
|
|
1
|
|
2
|
|
3
|
|
4
|
Locate the Legends section. In the table, enter the following settings:
|
|
5
|
|
6
|
|
1
|
|
2
|
|
3
|
|
4
|
|
5
|
|
6
|
|
7
|
|
1
|
|
2
|
In the Settings window for 1D Plot Group, type Generation/Recombination rates in the Label text field.
|
|
3
|
|
1
|
In the Model Builder window, expand the Generation/Recombination rates node, then click Line Graph 1.
|
|
2
|
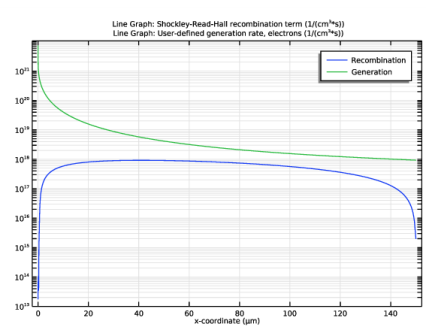
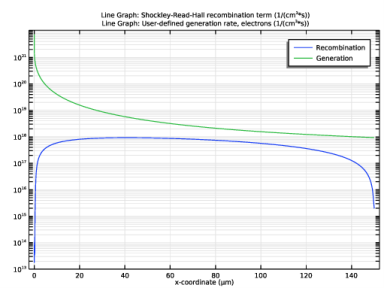
In the Settings window for Line Graph, click Replace Expression in the upper-right corner of the y-Axis Data section. From the menu, choose Component 1 (comp1)>Semiconductor>Generation and recombination>semi.Rsrh - Shockley-Read-Hall recombination term - 1/(m³·s).
|
|
3
|
|
4
|
Locate the Legends section. In the table, enter the following settings:
|
|
1
|
In the Model Builder window, under Results>Generation/Recombination rates right-click Line Graph 1 and choose Duplicate.
|
|
2
|
In the Settings window for Line Graph, click Replace Expression in the upper-right corner of the y-Axis Data section. From the menu, choose Component 1 (comp1)>Semiconductor>Generation and recombination>semi.udg1.Gn - User-defined generation rate, electrons - 1/(m³·s).
|
|
3
|
Locate the Legends section. In the table, enter the following settings:
|
|
4
|
|
1
|
|
2
|
|
3
|
|
4
|
|
5
|
|
1
|
|
2
|
|
3
|
|
1
|
|
2
|
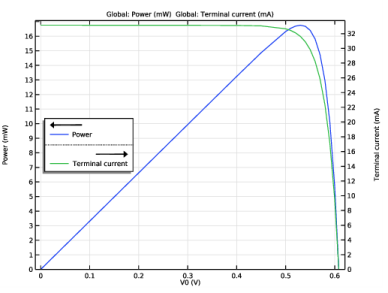
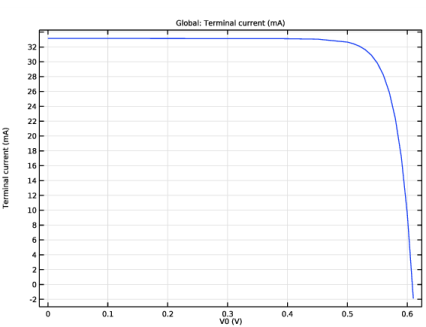
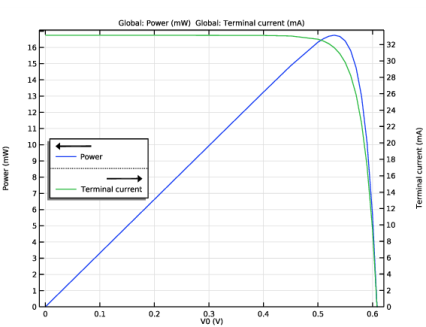
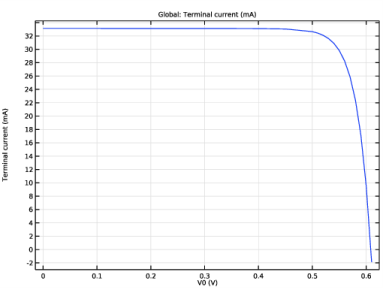
In the Settings window for Global, click Replace Expression in the upper-right corner of the y-Axis Data section. From the menu, choose Component 1 (comp1)>Semiconductor>Terminals>semi.I0_1 - Terminal current - A.
|
|
3
|
|
4
|
|
1
|
|
2
|
|
3
|
|
1
|
|
2
|
|
1
|
|
2
|
|
1
|
|
2
|
|
3
|
|
4
|
|
5
|
|
6
|
|
7
|
|
8
|
|
9
|
|
10
|