PDF

Rowland Circle Spectrometer
Introduction
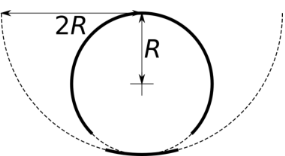
The Rowland circle is a circle of radius R that lies tangent to a concave curved diffraction grating of radius 2R. The basic concept is illustrated in Figure 1; the Rowland circle itself and the concave grating are illustrated by the long and short solid black lines, respectively.
Figure 1: The Rowland circle.
If light enters through a narrow slit located anywhere along the Rowland circle and hits the diffraction grating, then the reflected light will be focused at some point along the same circle. If the incoming light is polychromatic, then the direction of the reflected light is a function of the wavelength and the diffraction order.
This tutorial model of a basic 2D Rowland circle spectrometer demonstrates how to define concave curved diffraction gratings using the Grating node, trace polychromatic light, specify which diffraction orders to release, and record the diffraction orders of released rays using an Auxiliary Dependent Variable node.
Model Definition
This tutorial model uses the Geometrical Optics interface to trace rays in a simple 2D geometry. The vacuum wavelength of the released light follows a uniform distribution between 400 nm and 700 nm. The built-in Grating boundary condition automatically detects which diffraction orders might be released, and a user-defined Auxiliary Dependent Variable is used to record which diffraction order each ray corresponds to.
Release of Polychromatic Light
By default, the rays in a Geometrical Optics model are monochromatic. In this example, a distribution of wavelengths is released by selecting Polychromatic, specify vacuum wavelength from the Wavelength distribution of released rays list in the physics interface Ray Release and Propagation section. Then, in ray release features (such as Release from Grid), you can specify whether the released rays all have the same wavelength, a list of wavelength values, or values sampled from a normal, lognormal, or uniform distribution.
Grating Equation
Some diffraction gratings can release both transmitted and reflected rays of various diffraction orders. This model concerns a purely reflective grating, so the transmitted orders are ignored.
The fundamental equation of rays reflected by a diffraction grating is
(1)
where
m (dimensionless integer) is the diffraction order,
λ (SI unit: m) is the wavelength,
d (SI unit: m) is the spacing between successive grooves or unit cells in the grating,
α (SI unit: rad) is the angle of incidence, and
βm (SI unit: rad) is the angle of reflection of the mth diffraction order.
Here λ should not be confused with the vacuum wavelength λ0; if the incident and reflected ray propagate through a medium with refractive index , then .
In addition, different authors will use different sign conventions to designate positive or negative diffraction orders, or to indicate whether the angles of reflection should be positive or negative. The sign convention used here is such that the angle of incidence is positive, the angle or reflection for the 0th order (specular reflection) is positive (), and higher positive diffraction orders bend farther away from the surface normal.
The Grating constant d that you specify in this model is actually somewhat smaller than the value of d used in Equation 1. For concave curved gratings, the classical interpretation of the grating constant is the projected distance between grooves in a tangent plane.
Existence of Diffraction Orders
A given diffraction order can exist if the value of m permits real values of α and βm in Equation 1. If light can hit the grating from any direction, then this requirement can be expressed as
If the angle of incidence α is known, then a stricter requirement can be applied,
(2)
The above formulas only indicate whether light of a certain diffraction order can be released at all. Even if a certain diffraction order can be released for some values of the angle of incidence, it might not be permitted for all values. In addition, these formulas alone cannot determine the relative intensity of rays of different diffraction orders, which would require a more in-depth understanding of the unit cell structure.
The Geometrical Optics interface is usable when the wavelength of radiation is much smaller than even the smallest geometric details in the model. Taking this requirement literally, it would seem impossible to use ray optics simulation to model diffraction gratings, which have details comparable to the wavelength. Instead of explicitly modeling the grating geometry on such a small scale, diffraction gratings are implemented using the Grating boundary condition, which takes a lumped approach by only tracing rays of each discrete diffraction order while not attempting to predict the pattern of evanescent waves in the near vicinity of the grating. When a ray hits the grating surface, then it is split into multiple reflected and/or transmitted rays depending on the number of Diffraction Order subnodes that have been added to the parent Grating node.
In the settings for the Grating node in the Geometrical Optics interface, a section called Automatic Diffraction Order Calculation is shown. You can click the Add Diffraction Orders button to automatically create a Diffraction Order subnode for every value of m that satisfies Equation 2.
Allocation of Secondary Rays
If the Grating node has at least two Diffraction Order subnodes (or at least one Diffraction Order subnode with both reflected and transmitted diffraction orders released), then the degrees of freedom corresponding to the incident ray will be used to trace either the transmitted or reflected ray of the first Diffraction Order subnode to appear. All other orders must be traced using secondary rays.
In the Geometrical Optics interface, a secondary ray is a ray whose position and direction are not specified directly, but are instead triggered by the interaction of an existing ray with a boundary condition in the model. For example, during a deterministic ray split at a Material Discontinuity boundary, the refracted ray uses the incident ray’s degrees of freedom, while the reflected ray is a secondary ray. Because a single ray can produce rays of many different diffraction order, the Grating boundary condition can potentially use up a large number of secondary rays.
You can specify the Maximum number of secondary rays in the physics interface Ray Release and Propagation section. If this number of secondary rays is reached, then the model will stop producing rays of higher diffraction orders, and a warning will be given when the study concludes.
Recording Diffraction Orders
In this example an Auxiliary Dependent Variable node is used to store information about the diffraction order of each released ray. For every Auxiliary Dependent Variable node added to the model, the number of degrees of freedom solved for increases by 1 per ray. Optionally, you can enter a Source, i.e. a time derivative for these variables. In this example, the time derivative is zero so the auxiliary variable just stores information about which Diffraction Order subnode released each ray.
Results and Discussion
A Ray Trajectories plot is shown in Figure 2. The color expression on the rays indicates their diffraction order. The incident rays are the orange-colored rays entering from the top left and propagating towards the grating on the bottom; the orange-colored rays propagating towards the top right are the reflected rays of order 0.
A similar Ray Trajectories plot is shown in Figure 3, except that the color expression is now the wavelength of the rays. A plot Filter has been used to replace the incident rays and the reflected zero-order rays with thick black lines, since otherwise they could have any arbitrary color (since the m = 0 order does not separate rays by wavelength).
From both Figure 2 and Figure 3 it is evident that the rays of diffraction orders m = -2 and m = -3 overlap near the left side of the Rowland circle. Another way of visualizing this overlap is with a 2D Histogram plot, as shown in Figure 4. In this plot, the horizontal axis is the sector angle where the reflected rays hit the Rowland circle, while the vertical axis is their diffraction order. Columns with two or more nonzero entries carry some risk of overlapping diffraction orders. Comparison with the ray diagrams suggests that the overlap between the m = -2 and m = -3 orders is real, while the apparent overlap between the m = 1 and m = 2 orders may just be an artifact of the finite number of bins used in this histogram. Increasing the number of wavelengths in the model, and the number of bins in the x-direction, should assuage any concerns about overlap between these orders.
Figure 2: Ray diagram. The color expression represents diffraction order.
Figure 3: Ray diagram. The color represents the vacuum wavelength of each ray, except that incident rays and those of zero diffraction order are colored black.
Figure 4: 2D Histogram plot comparing the sector angle of reflected rays, measured counterclockwise from the positive y-axis, to their diffraction order.
Application Library path: Ray_Optics_Module/Tutorials/rowland_circle_spectrometer
Modeling Instructions
From the File menu, choose New.
New
In the New window, click  Model Wizard.
Model Wizard
1
In the Model Wizard window, click  2D.
2
In the Select Physics tree, select Optics>Ray Optics>Geometrical Optics (gop).
3
Click Add.
4
Click  Study.
5
In the Select Study tree, select Preset Studies for Selected Physics Interfaces>Ray Tracing.
6
Global Definitions
Parameters 1
1
In the Model Builder window, under Global Definitions click Parameters 1.
2
In the Settings window for Parameters, locate the Parameters section.
3
Component 1 (comp1)
1
In the Model Builder window, click Component 1 (comp1).
2
In the Settings window for Component, locate the Curved Mesh Elements section.
3
From the Geometry shape function list, choose Cubic Lagrange. The ray tracing algorithm used by the Geometrical Optics interface computes the refracted ray direction based on a discretized geometry via the underlying finite element mesh. A cubic geometry shape order usually introduces less discretization error compared to the default, which uses linear and quadratic polynomials.
Geometry 1
Circle 1 (c1)
1
In the Geometry toolbar, click  Circle.
2
In the Settings window for Circle, locate the Object Type section.
3
From the Type list, choose Curve.
4
Locate the Size and Shape section. In the Radius text field, type R.
5
In the Sector angle text field, type 360-2*alpha.
6
Locate the Rotation Angle section. In the Rotation text field, type -90+alpha.
Circle 2 (c2)
1
In the Geometry toolbar, click  Circle.
2
In the Settings window for Circle, locate the Object Type section.
3
From the Type list, choose Curve.
4
Locate the Size and Shape section. In the Radius text field, type 2*R.
5
In the Sector angle text field, type alpha.
6
Locate the Position section. In the y text field, type R.
7
Locate the Rotation Angle section. In the Rotation text field, type 270-alpha/2.
Delete Entities 1 (del1)
1
In the Geometry toolbar, click  Delete.
2
In the Settings window for Delete Entities, locate the Entities or Objects to Delete section.
3
From the Geometric entity level list, choose Boundary.
4
On the object c1, select Boundaries 5 and 6 only.
5
On the object c2, select Boundaries 2 and 3 only.
These selected edges are the radii that bound each of the two circular arcs.
6
Click  Build All Objects.
7
Click the  Zoom Extents button in the Graphics toolbar.
Geometrical Optics (gop)
By default monochromatic light will be traced. A quick adjustment to the physics interface settings will allow light to be released with a distribution of different wavelengths.
1
In the Model Builder window, under Component 1 (comp1) click Geometrical Optics (gop).
2
In the Settings window for Geometrical Optics, locate the Ray Release and Propagation section.
3
From the Wavelength distribution of released rays list, choose Polychromatic, specify vacuum wavelength.
4
Select the Use geometry normals for ray-boundary interactions check box.
Next add an Auxiliary Dependent Variable, an extra degree of freedom to track the diffraction order of each released secondary ray.
Auxiliary Dependent Variable 1
1
In the Physics toolbar, click  Global and choose Auxiliary Dependent Variable.
2
In the Settings window for Auxiliary Dependent Variable, locate the Auxiliary Dependent Variable section.
3
In the Field variable name text field, type m.
Optionally a derivative with respect to time or optical path length can be specified in the Source field. In this example, the default of 0 will be used so that the variable does not change after the secondary rays are released.
Release from Grid 1
1
In the Physics toolbar, click  Global and choose Release from Grid.
2
In the Settings window for Release from Grid, locate the Initial Coordinates section.
3
In the qx,0 text field, type -R*sin(phi0).
4
In the qy,0 text field, type R*cos(phi0).
5
Click Preview Initial Coordinates in the upper-right corner of the Initial Coordinates section. A red dot will be shown in the Graphics window, marking the location of the entrance pupil on the Rowland circle.
6
Locate the Ray Direction Vector section. From the Ray direction vector list, choose Conical.
7
In the Nw text field, type 10.
8
Specify the r vector as
This expression for the cone axis will aim the incoming light at the center of the concave grating which will be located at the bottom of the Rowland circle.
9
In the α text field, type 2[deg].
10
Locate the Vacuum Wavelength section. From the Distribution function list, choose Uniform.
The default values of the minimum and maximum wavelength cover most of the visible part of the electromagnetic spectrum.
11
In the N text field, type 10.
Grating 1
1
In the Physics toolbar, click  Boundaries and choose Grating.
2
3
In the Settings window for Grating, locate the Device Properties section.
4
From the Rays to release list, choose Reflected.
5
In the d text field, type 1.5[um].
6
From the Interpretation of grating constant list, choose Projected unit cell width.
7
Locate the Automatic Diffraction Order Calculation section. Click Add Diffraction Orders.
Clicking the Add Diffraction Orders button will cause a set of Diffraction Order subnodes to be created.
Initializing Auxiliary Variables for Secondary Rays
For each of the Diffraction Order subnodes, repeat the following steps:
1
In the Model Builder window, click Diffraction Order (m = -3).
2
Expand the Auxiliary Dependent Variables, Reflected Ray section.
3
Select the Assign new value to auxiliary variable : m check box.
4
Wall 1
1
In the Physics toolbar, click  Boundaries and choose Wall.
2
3
Keep the default value from the Wall condition list, Freeze. Rays that hit the selected boundaries will stop propagating, but their final positions will still be available for postprocessing.
Mesh 1
1
In the Model Builder window, under Component 1 (comp1) click Mesh 1.
2
In the Settings window for Mesh, locate the Physics-Controlled Mesh section.
3
From the Element size list, choose Extremely fine.
4
Click  Build All.
Study 1
Step 1: Ray Tracing
1
In the Model Builder window, under Study 1 click Step 1: Ray Tracing.
2
In the Settings window for Ray Tracing, locate the Study Settings section.
3
From the Time-step specification list, choose Specify maximum path length.
4
In the Lengths text field, type 0 4*R.
5
In the Home toolbar, click  Compute.
Results
Ray Trajectories, Diffraction Order
1
In the Settings window for 2D Plot Group, type Ray Trajectories, Diffraction Order in the Label text field.
2
Click to expand the Title section. From the Title type list, choose Label.
3
In the Model Builder window, expand the Ray Trajectories, Diffraction Order node.
Color Expression 1
1
In the Model Builder window, expand the Results>Ray Trajectories, Diffraction Order>Ray Trajectories 1 node, then click Color Expression 1.
2
In the Settings window for Color Expression, locate the Expression section.
3
In the Expression text field, type m.
4
Select the Description check box.
5
In the associated text field, type Diffraction order number.
6
Locate the Coloring and Style section. From the Color table list, choose Traffic.
7
In the Ray Trajectories, Diffraction Order toolbar, click  Plot. Compare the resulting image to Figure 2.
Ray Trajectories, Vacuum Wavelength (nm)
1
In the Model Builder window, right-click Ray Trajectories, Diffraction Order and choose Duplicate.
2
In the Settings window for 2D Plot Group, type Ray Trajectories, Vacuum Wavelength (nm) in the Label text field.
3
In the Model Builder window, expand the Ray Trajectories, Vacuum Wavelength (nm) node.
Color Expression 1
1
In the Model Builder window, expand the Results>Ray Trajectories, Vacuum Wavelength (nm)>Ray Trajectories 1 node, then click Color Expression 1.
2
In the Settings window for Color Expression, click Replace Expression in the upper-right corner of the Expression section. From the menu, choose Component 1 (comp1)>Geometrical Optics>Ray properties>gop.lambda0 - Vacuum wavelength - m.
3
Locate the Expression section. From the Unit list, choose nm.
4
Locate the Coloring and Style section. From the Color table list, choose Spectrum.
Filter 1
1
In the Model Builder window, click Filter 1.
2
In the Settings window for Filter, locate the Ray Selection section.
3
From the Rays to include list, choose Logical expression.
4
In the Logical expression for inclusion text field, type m!=0.
Ray Trajectories, Vacuum Wavelength (nm)
In the Model Builder window, under Results click Ray Trajectories, Vacuum Wavelength (nm).
Ray Trajectories 2
1
In the Ray Trajectories, Vacuum Wavelength (nm) toolbar, click  More Plots and choose Ray Trajectories.
2
In the Settings window for Ray Trajectories, locate the Coloring and Style section.
3
Find the Line style subsection. From the Type list, choose Tube.
Filter 1
1
In the Ray Trajectories, Vacuum Wavelength (nm) toolbar, click  Filter.
2
In the Settings window for Filter, locate the Ray Selection section.
3
From the Rays to include list, choose Logical expression.
4
In the Logical expression for inclusion text field, type m==0.
5
In the Ray Trajectories, Vacuum Wavelength (nm) toolbar, click  Plot. Compare the resulting image to Figure 3.
2D Histogram
1
In the Home toolbar, click  Add Plot Group and choose 2D Plot Group.
2
In the Settings window for 2D Plot Group, type 2D Histogram in the Label text field.
3
Locate the Data section. From the Dataset list, choose Ray 1.
Histogram 1
1
In the 2D Histogram toolbar, click  More Plots and choose Histogram.
2
In the Settings window for Histogram, locate the x-Expression section.
3
In the Expression text field, type atan2(-x,y).
4
From the Unit list, choose °.
5
Locate the y-Expression section. In the Expression text field, type m.
6
Select the Description check box.
7
8
Locate the Bins section. Find the y bins subsection. From the Entry method list, choose Limits.
9
Click  Range.
10
In the Range dialog box, type -3.5 in the Start text field.
11
In the Step text field, type 1.
12
In the Stop text field, type 3.5.
13
Click Replace.
14
In the Settings window for Histogram, locate the Output section.
15
From the Function list, choose Discrete.
16
Locate the Coloring and Style section. From the Color table list, choose JupiterAuroraBorealis.
17
In the 2D Histogram toolbar, click  Plot. Compare the resulting image to Figure 4.