PDF

Conical Antenna
Introduction
Conical antennas are useful for many applications due to their broadband characteristics and relative simplicity. This example includes an analysis of the antenna impedance and the radiation pattern as functions of the frequency for a monoconical antenna with a finite ground plane and a 50 Ω coaxial feed. The rotational symmetry makes it possible to model this in axially symmetric 2D. When modeling in 2D, you can use a dense mesh, giving an excellent accuracy for a wide range of frequencies.
Model Definition
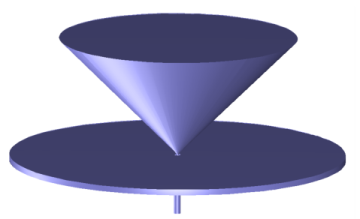
The antenna geometry consists of a 0.2 m tall metallic cone with a top angle of 90 degrees on a finite ground plane of a 0.282 m radius. The coaxial feed has a central conductor of 1.5 mm radius and an outer conductor (screen) of 4.916 mm radius separated by a Teflon dielectric of relative permittivity of 2.07. The central conductor of the coaxial cable is connected to the cone, and the screen is connected to the ground plane.
Figure 1: The geometry of the antenna. The central conductor of the coaxial cable is connected to the metallic cone, and the cable screen is connected to the finite ground plane.
The model takes advantage of the rotational symmetry of the problem, which allows modeling in 2D using cylindrical coordinates. You can then use a very fine mesh to achieve an excellent accuracy.
Domain Equations
An electromagnetic wave propagating in a coaxial cable is characterized by transverse electromagnetic (TEM) fields. Assuming time-harmonic fields with complex amplitudes containing the phase information, you have:
where z is the direction of propagation and r, , and z are cylindrical coordinates centered on axis of the coaxial cable. Z is the wave impedance in the dielectric of the cable, and C is an arbitrary constant. The angular frequency is denoted by ω. The propagation constant, k, relates to the wavelength in the medium λ as
In the air, the electric field also has a finite axial component whereas the magnetic field is purely azimuthal. Thus it is possible to model the antenna using an axisymmetric transverse magnetic (TM) formulation, and the wave equation becomes scalar in : 
Boundary Conditions
The boundary conditions for the metallic surfaces are:
At the feed point, a matched coaxial port boundary condition is used to make the boundary transparent to the wave. The antenna is radiating into free space, but you can only discretize a finite region. Therefore, truncate the geometry some distance from the antenna using a scattering boundary condition allowing for outgoing spherical waves to pass with very little reflections. A symmetry boundary condition is automatically applied on boundaries at r = 0.
Results and Discussion
Figure 2 shows the antenna impedance as a function of frequency. Ideally, the antenna impedance should be matched to the characteristic impedance of the feed, 50 Ω, to obtain maximum transmission into free space. This is quite well fulfilled in the high frequency range.
Figure 2: The antenna impedance in Ω as a function of frequency from 200 MHz to 1.5 GHz. The solid line shows the radiation resistance and the dotted line represents the reactance.
Figure 3 shows the antenna radiation pattern in the near-field for three different frequencies. The effect of the finite diameter of the ground plane is to lift the main lobe from the horizontal plane. For an infinite ground plane or in the high-frequency limit, the radiation pattern is symmetric around zero elevation. This is easy to understand, as an infinite ground plane can be replaced by a mirror image of the monocone below the plane. Such a biconical antenna is symmetric around zero elevation and has its main lobe in the horizontal direction. The decreased lobe lifting at higher frequencies is just about visible in Figure 3.
Figure 4 shows the antenna radiation pattern in the far field for the same frequencies as the radiation pattern at the boundary in Figure 3.
Figure 3: Polar plot of the antenna radiation pattern in the near field versus the elevation angle for 200 MHz, 800 MHz, and 1.5 GHz. The scale is logarithmic.
Figure 4: Polar plot of the antenna radiation pattern for the far field versus the elevation angle for 200 MHz, 800 MHz, and 1.5 GHz. This plot is normalized differently but has a shape resembling the near field.
As the frequency increases the antenna impedance gets closer to 50 Ω, which means that a voltage generator connected to the input of the antenna should have an output impedance of 50 Ω.
Application Library path: RF_Module/Antennas/conical_antenna
Modeling Instructions
From the File menu, choose New.
New
In the New window, click  Model Wizard.
Model Wizard
1
In the Model Wizard window, click  2D Axisymmetric.
2
In the Select Physics tree, select Radio Frequency>Electromagnetic Waves, Frequency Domain (emw).
3
Click Add.
4
Click  Study.
5
In the Select Study tree, select General Studies>Frequency Domain.
6
Geometry 1
Import 1 (imp1)
1
In the Home toolbar, click  Import.
2
In the Settings window for Import, locate the Import section.
3
Click  Browse.
4
5
Click  Import.
The imported geometry is effectively a half circle with the metal areas removed. You model the electromagnetic waves in the air and the dielectric material inside the coaxial cable. There is no need to include the metal as a domain in the model because the fields in it are essentially zero except on its surface.
Global Definitions
Prepare for the impedance computation by making a few definitions.
Parameters 1
1
In the Model Builder window, under Global Definitions click Parameters 1.
2
In the Settings window for Parameters, locate the Parameters section.
3
50 Ω
Definitions
Variables 1
1
In the Home toolbar, click  Variables and choose Local Variables.
2
In the Settings window for Variables, locate the Variables section.
3
emw.S11 is the name of the automatically computed reflection S-parameter.
Define the following selections in order to get easy access to some frequently used domains and boundaries.
Air
1
In the Definitions toolbar, click  Explicit.
2
In the Settings window for Explicit, type Air in the Label text field.
3
Dielectric
1
In the Definitions toolbar, click  Explicit.
2
In the Settings window for Explicit, type Dielectric in the Label text field.
The dielectric domain is inside the coaxial cable just below the cone. It is easier to select it if you zoom in a little.
3
Outer Air Boundaries
1
In the Definitions toolbar, click  Explicit.
2
In the Settings window for Explicit, type Outer Air Boundaries in the Label text field.
3
Locate the Input Entities section. From the Geometric entity level list, choose Boundary.
4
With all selections and expressions now defined, it is time to set up the materials and the physics of the model.
Add Material
1
In the Home toolbar, click  Add Material to open the Add Material window.
2
Go to the Add Material window.
3
4
Click Add to Component in the window toolbar.
5
In the Home toolbar, click  Add Material to close the Add Material window.
Materials
Air (mat1)
1
In the Settings window for Material, locate the Geometric Entity Selection section.
2
From the Selection list, choose Air.
Material 2 (mat2)
1
In the Model Builder window, right-click Materials and choose Blank Material.
2
In the Settings window for Material, locate the Geometric Entity Selection section.
3
From the Selection list, choose Dielectric.
4
Locate the Material Contents section. In the table, enter the following settings:
Electromagnetic Waves, Frequency Domain (emw)
Port 1
1
In the Model Builder window, under Component 1 (comp1) right-click Electromagnetic Waves, Frequency Domain (emw) and choose Port.
Set up Boundary 6, at the bottom of the coaxial cable, to be a Port. You can zoom in on this part of the geometry to easier find and select this boundary.
2
3
In the Settings window for Port, locate the Port Properties section.
4
From the Type of port list, choose Coaxial.
For the first port, wave excitation is on by default.
Scattering Boundary Condition 1
1
In the Physics toolbar, click  Boundaries and choose Scattering Boundary Condition.
2
In the Settings window for Scattering Boundary Condition, locate the Boundary Selection section.
3
From the Selection list, choose Outer Air Boundaries.
The Scattering boundary condition is a simple way of letting the waves undergo only minor artificial reflections as they leave the computational domain through the exterior boundaries. To minimize these reflections, but at a greater computational cost, you can use Perfectly Matched Layers).
Perfect Electric Conductor 1
As you can see if you click the Perfect Electric Conductor node under Electromagnetic Waves, the physical boundaries to which you have not assigned any boundary condition will by default be considered perfect electric conductors. This is a good approximation for most metals throughout the frequency range considered in this model.
Far-Field Domain 1
1
In the Physics toolbar, click  Domains and choose Far-Field Domain.
2
Far-Field Calculation 1
1
In the Model Builder window, expand the Far-Field Domain 1 node, then click Far-Field Calculation 1.
2
In the Settings window for Far-Field Calculation, locate the Boundary Selection section.
3
From the Selection list, choose Outer Air Boundaries.
Adding a Far Field Calculation feature does not affect the physics of the model, but makes it possible to study the far field generated by the antenna. Select the boundaries to use for this computation so that, in the physical (3D) geometry, they surround all sources and reflecting objects. The outer air boundaries are a convenient choice.
Mesh 1
In the Model Builder window, under Component 1 (comp1) right-click Mesh 1 and choose Build All.
Study 1
Step 1: Frequency Domain
1
In the Model Builder window, under Study 1 click Step 1: Frequency Domain.
2
In the Settings window for Frequency Domain, locate the Study Settings section.
3
In the Frequencies text field, type range(200[MHz],25[MHz],1.5[GHz]).
The frequency range you just entered runs from 200 MHz to 1.5 GHz in steps of 25 MHz.
4
In the Home toolbar, click  Compute.
Results
Electric Field (emw)
The plot that appears once the solution process is finished shows the norm of the electric field at 1.5 GHz. The reason it is mostly dark blue is because the range is dominated by the high values in and near the coaxial cable. To better see how the wave propagates, try plotting the instantaneous value of the H-field using a manual range.
Surface
1
In the Model Builder window, expand the Electric Field (emw) node, then click Surface.
2
In the Settings window for Surface, click Replace Expression in the upper-right corner of the Expression section. From the menu, choose Component 1 (comp1)>Electromagnetic Waves, Frequency Domain>Magnetic>Magnetic field - A/m>emw.Hphi - Magnetic field, phi component.
3
Click to expand the Range section. Select the Manual color range check box.
4
In the Minimum text field, type -0.5.
5
In the Maximum text field, type 0.5.
6
Locate the Coloring and Style section. From the Color table list, choose Wave.
7
In the Electric Field (emw) toolbar, click  Plot.
8
Click the  Zoom Extents button in the Graphics toolbar.
Smith Plot (emw)
Radiation Pattern 1
1
In the Model Builder window, expand the 2D Far Field (emw) node, then click Radiation Pattern 1.
2
In the Settings window for Radiation Pattern, locate the Evaluation section.
3
Find the Angles subsection. In the Number of angles text field, type 100.
4
Find the Reference direction subsection. In the x text field, type -1.
5
In the z text field, type 0.
6
In the 2D Far Field (emw) toolbar, click  Plot.
To plot the impedance as a function of the frequency, set up a 1D plot.
1D Plot Group 6
In the Home toolbar, click  Add Plot Group and choose 1D Plot Group.
Global 1
1
Right-click 1D Plot Group 6 and choose Global.
2
In the Settings window for Global, locate the y-Axis Data section.
3
4
Click to expand the Coloring and Style section. Find the Line style subsection. From the Line list, choose Cycle.
5
In the 1D Plot Group 6 toolbar, click  Plot.
You have now reproduced Figure 2. Next, visualize the near-field and far-field radiation patterns using polar plots.
Polar Plot Group 7
1
In the Home toolbar, click  Add Plot Group and choose Polar Plot Group.
Select a few of the frequencies from the list of parameter values. Showing the radiation pattern for all of them would take a bit of time and lead to a cluttered plot.
2
In the Settings window for Polar Plot Group, locate the Data section.
3
From the Parameter selection (freq) list, choose From list.
4
In the Parameter values (freq (GHz)) list, choose 0.2, 0.8, and 1.5.
Use Ctrl-key to select multiple frequencies.
Line Graph 1
1
Right-click Polar Plot Group 7 and choose Line Graph.
2
In the Settings window for Line Graph, locate the Selection section.
3
From the Selection list, choose Outer Air Boundaries.
4
Click Replace Expression in the upper-right corner of the r-Axis Data section. From the menu, choose Component 1 (comp1)>Electromagnetic Waves, Frequency Domain>Energy and power>emw.nPoav - Power outflow, time average - W/m².
5
Locate the r-Axis Data section. In the Expression text field, type 10*log10(emw.nPoav).
The variable emw.nPoav represents the outgoing power flow through the boundaries where it is evaluated. The expression you just entered gives you the same in a logarithmic scale.
6
Select the Description check box.
7
In the associated text field, type Near-field radiation pattern.
8
Locate the θ Angle Data section. From the Parameter list, choose Expression.
9
In the Expression text field, type atan2(z,r).
10
Click to expand the Coloring and Style section. Find the Line style subsection. From the Line list, choose Cycle.
11
Click to collapse the Coloring and Style section. Click to expand the Legends section. Select the Show legends check box.
12
From the Legends list, choose Manual.
13
14
Click to collapse the Legends section. In the Polar Plot Group 7 toolbar, click  Plot.
15
Click the  Zoom Extents button in the Graphics toolbar.
Your near-field radiation plot should look like that in Figure 3.
Finally, visualize the far-field radiation pattern.
Polar Plot Group 8
In the Model Builder window, under Results right-click Polar Plot Group 7 and choose Duplicate.
Line Graph 1
1
In the Model Builder window, expand the Polar Plot Group 8 node, then click Line Graph 1.
2
In the Settings window for Line Graph, click Replace Expression in the upper-right corner of the r-Axis Data section. From the menu, choose Component 1 (comp1)>Electromagnetic Waves, Frequency Domain>Far field>emw.normdBEfar - Far-field norm, dB - dB.
3
Locate the r-Axis Data section. In the Description text field, type Far-field radiation pattern.
4
In the Polar Plot Group 8 toolbar, click  Plot.
The plot should look like that in Figure 4.